Page 90: of Offshore Engineer Magazine (Aug/Sep 2014)
Read this page in Pdf, Flash or Html5 edition of Aug/Sep 2014 Offshore Engineer Magazine
Subsea
Combating fatigue
Michael Long Ge and Himanshu a well-understood phenomenon. The an analytical solution which accounts measured fatigue damage due to VIV for damage due to both wave and VIV
Maheshwari explain a new is typically calculated by mode shape effects. With the new method, the methodology developed by BP reconstruction in the frequency domain, measured acceleration data is converted using the logged accelerations at various into curvature, and then fatigue damage and 2H Ofshore to monitor riser locations. along the length of riser and conductor fatigue on drilling riser systems.
In addition to VIV fatigue, direct is calculated. This new methodology has wave loading and vessel motions also been validated with both fnite element n support of its commitment to safe contribute to the total fatigue damage. analysis (FEA) and feld data, and sensi- and reliable operations, BP has been Sometimes wave fatigue may have more tivities to various parameters have been
I continuously developing a program to contributions than VIV fatigue damage, considered.
assess and maintain structural integrity especially in shallow water depths and/
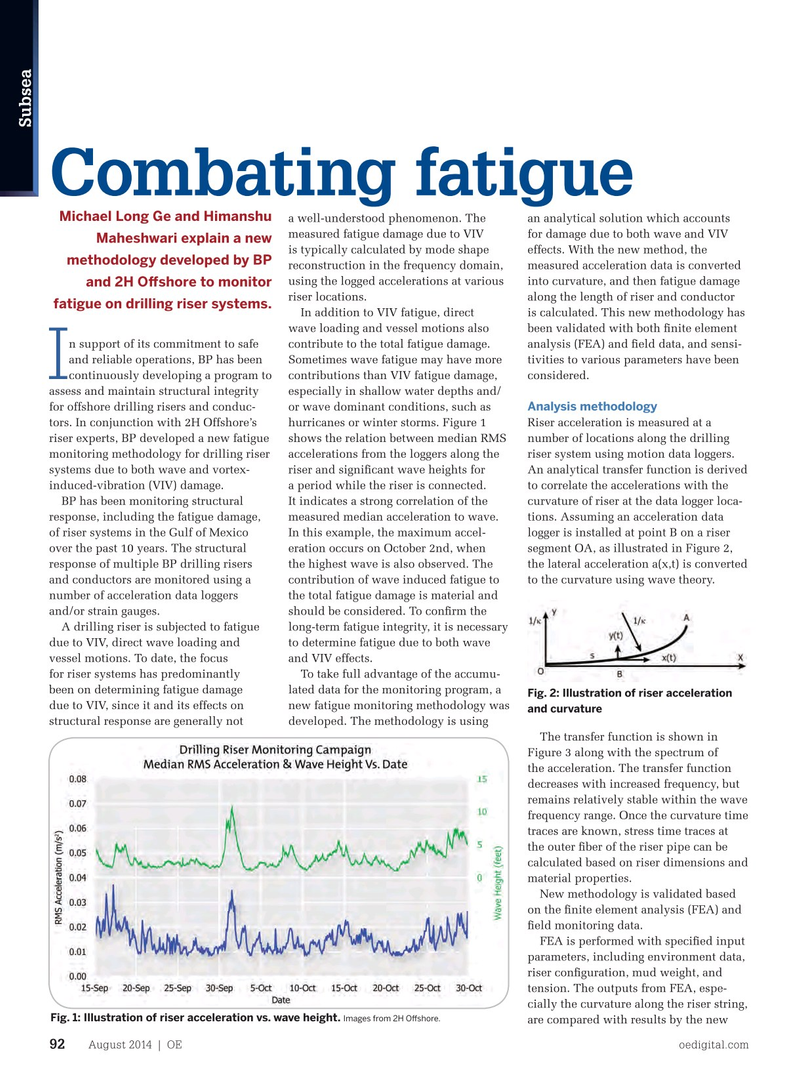
Analysis methodology for offshore drilling risers and conduc- or wave dominant conditions, such as tors. In conjunction with 2H Offshore’s hurricanes or winter storms. Figure 1 Riser acceleration is measured at a riser experts, BP developed a new fatigue shows the relation between median RMS number of locations along the drilling monitoring methodology for drilling riser accelerations from the loggers along the riser system using motion data loggers. systems due to both wave and vortex- riser and signifcant wave heights for An analytical transfer function is derived induced-vibration (VIV) damage. a period while the riser is connected. to correlate the accelerations with the
BP has been monitoring structural It indicates a strong correlation of the curvature of riser at the data logger loca- response, including the fatigue damage, measured median acceleration to wave. tions. Assuming an acceleration data of riser systems in the Gulf of Mexico In this example, the maximum accel- logger is installed at point B on a riser over the past 10 years. The structural eration occurs on October 2nd, when segment OA, as illustrated in Figure 2, response of multiple BP drilling risers the highest wave is also observed. The the lateral acceleration a(x,t) is converted and conductors are monitored using a contribution of wave induced fatigue to to the curvature using wave theory.
number of acceleration data loggers the total fatigue damage is material and and/or strain gauges. should be considered. To confrm the
A drilling riser is subjected to fatigue long-term fatigue integrity, it is necessary due to VIV, direct wave loading and to determine fatigue due to both wave vessel motions. To date, the focus and VIV effects. for riser systems has predominantly To take full advantage of the accumu- been on determining fatigue damage lated data for the monitoring program, a
Fig. 2: Illustration of riser acceleration due to VIV, since it and its effects on new fatigue monitoring methodology was and curvature structural response are generally not developed. The methodology is using
The transfer function is shown in
Figure 3 along with the spectrum of the acceleration. The transfer function decreases with increased frequency, but remains relatively stable within the wave frequency range. Once the curvature time traces are known, stress time traces at the outer fber of the riser pipe can be calculated based on riser dimensions and material properties.
New methodology is validated based on the fnite element analysis (FEA) and feld monitoring data.
FEA is performed with specifed input parameters, including environment data, riser confguration, mud weight, and tension. The outputs from FEA, espe- cially the curvature along the riser string,
Fig. 1: Illustration of riser acceleration vs. wave height.
Images from 2H Ofshore.
are compared with results by the new
August 2014 | OE oedigital.com 92 000-OE0814_Subsea2_2H.indd 92 7/22/14 3:38 PM

 89
89

 91
91