
Page 91: of Offshore Engineer Magazine (Aug/Sep 2014)
Read this page in Pdf, Flash or Html5 edition of Aug/Sep 2014 Offshore Engineer Magazine
 90
90
 92
92
methodology. The advantage of using FEA results the comparison of the curvature obtain the feld curvature. The
SubseaEyebrow to validate the methodology is that there is no noise between the analytical transfer curvature time traces from the two and g-contamination in the accelerations and cur- method and the strain gauge mea- sources match well, as zoomed vature time traces. There are also no uncertainties surement. The stress derived from between 200 and 600 seconds. in the added mass and tension values. In addition, the strain gauge sensor is used to The low frequency contents below the validation can be carried out along the entire riser length instead of the logger locations.
An example deepwater riser confguration is used for FEA validation. A sea state with a signif- cant wave height (Hs) of 6.56ft and a peak period an analytical solution which accounts (Tp) of 7.6 seconds is selected, since this sea state for damage due to both wave and VIV causes the largest fatigue damage on riser compared effects. With the new method, the with other sea states from the metocean data. An measured acceleration data is converted added mass coeffcient of 1.0 is considered for into curvature, and then fatigue damage both the FEA and analytical transfer methodology along the length of riser and conductor (ATM). is calculated. This new methodology has A time trace of the curvature obtained from the been validated with both fnite element analytical transfer method is compared with that analysis (FEA) and feld data, and sensi- obtained from FEA output, as shown in Figure 4. tivities to various parameters have been The curvature from the analytical transfer method considered. matches well with FEA results for both the phase response and the curvature amplitudes.
Analysis methodology
The standard deviations are also compared along
Riser acceleration is measured at a the riser length in Figure 5. The standard devia-
Fig.3: Transfer Function number of locations along the drilling tions of the curvature from FEA and the analytical riser system using motion data loggers. transfer method agree along the riser length except
An analytical transfer function is derived the top 60ft zone that is close to the tension ring to correlate the accelerations with the where the joint dimension is modeled slightly dif- curvature of riser at the data logger loca- ferent in both methods. The top slick joints below tions. Assuming an acceleration data the outer barrel consist of three pup joints: 40ft, logger is installed at point B on a riser 20ft and 5ft. The top element in Figure 5 is right segment OA, as illustrated in Figure 2, below the outer barrel. The outer barrel OD is 25in, the lateral acceleration a(x,t) is converted while the top pup joint has a drag OD of 23.4in. to the curvature using wave theory. The drag OD the pup joints are chosen according to given dry and wet weight. The ATM method considers the properties at the interface of two dif- ferent joints, which cause the results to be slightly different from the FEA method.
Field monitoring data validation
The validation of the methodology is also con-
Fig. 2: Illustration of riser acceleration ducted using feld measurement data. A set of and curvature
Fig. 4: curvature comparison between FLEXCOM and analytical transfer method by 12 motion loggers and two strain sensors are
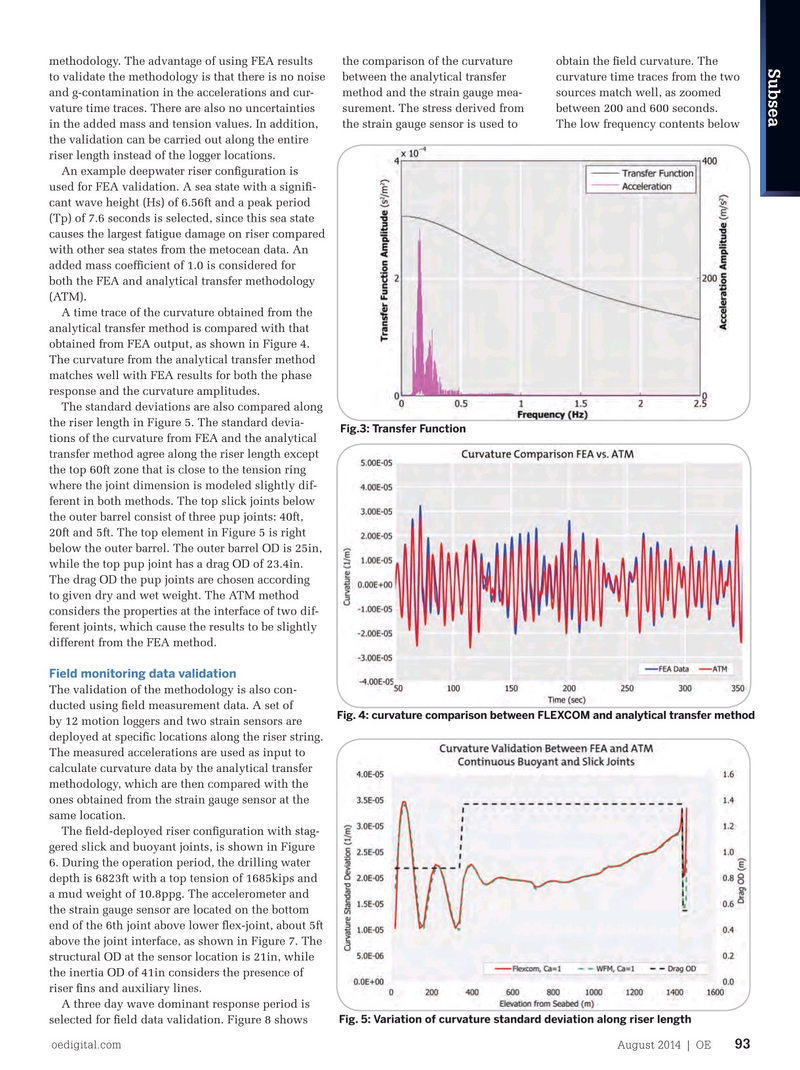
The transfer function is shown in deployed at specifc locations along the riser string.
Figure 3 along with the spectrum of The measured accelerations are used as input to the acceleration. The transfer function calculate curvature data by the analytical transfer decreases with increased frequency, but methodology, which are then compared with the remains relatively stable within the wave ones obtained from the strain gauge sensor at the frequency range. Once the curvature time same location.
traces are known, stress time traces at The feld-deployed riser confguration with stag- the outer fber of the riser pipe can be gered slick and buoyant joints, is shown in Figure calculated based on riser dimensions and 6. During the operation period, the drilling water material properties. depth is 6823ft with a top tension of 1685kips and
New methodology is validated based a mud weight of 10.8ppg. The accelerometer and on the fnite element analysis (FEA) and the strain gauge sensor are located on the bottom feld monitoring data. end of the 6th joint above lower fex-joint, about 5ft
FEA is performed with specifed input above the joint interface, as shown in Figure 7. The parameters, including environment data, structural OD at the sensor location is 21in, while riser confguration, mud weight, and the inertia OD of 41in considers the presence of tension. The outputs from FEA, espe- riser fns and auxiliary lines. cially the curvature along the riser string, A three day wave dominant response period is
Fig. 5: Variation of curvature standard deviation along riser length are compared with results by the new selected for feld data validation. Figure 8 shows oedigital.com August 2014 | OE 93 000-OE0814_Subsea2_2H.indd 93 7/22/14 3:38 PM