
Page 92: of Offshore Engineer Magazine (Aug/Sep 2014)
Read this page in Pdf, Flash or Html5 edition of Aug/Sep 2014 Offshore Engineer Magazine
 91
91
 93
93
Subsea
Figure 8: Curvature Comparison between Analytical Transfer Method and Field Data In Time Serial
Figure 6: Riser Confguration for Staggered Joints
Figure 9: Curvature Comparison between Analytical Transfer Method and
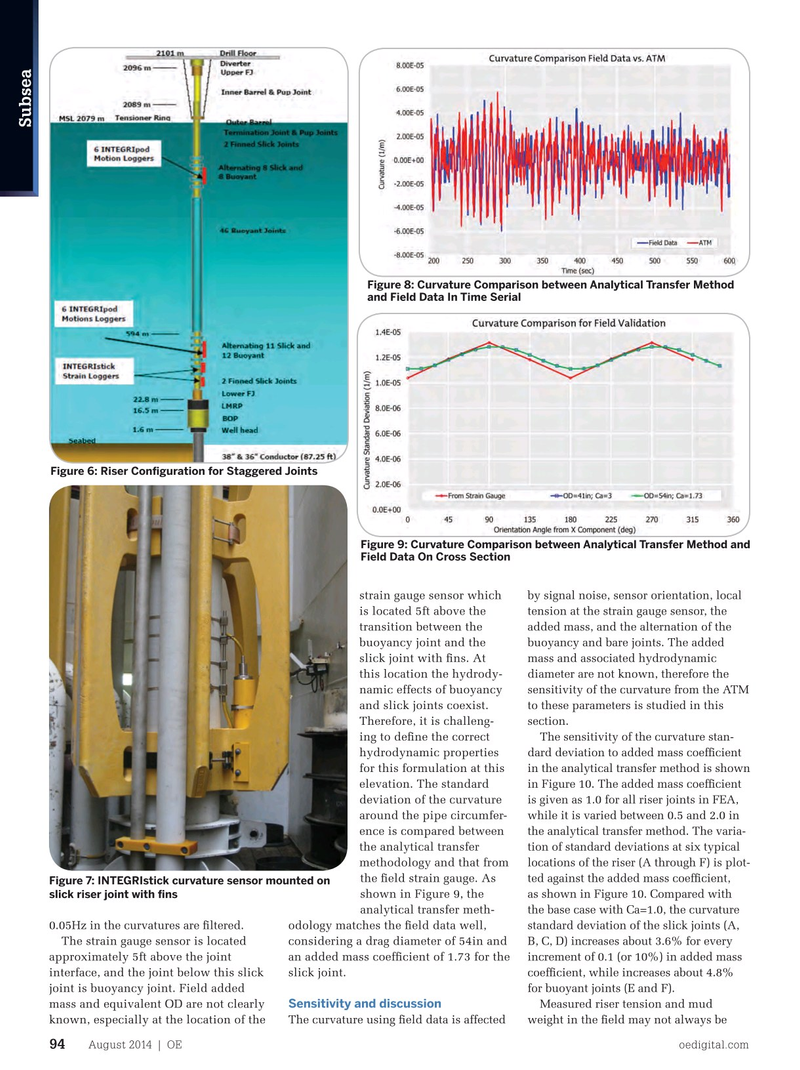
Field Data On Cross Section by signal noise, sensor orientation, local strain gauge sensor which tension at the strain gauge sensor, the is located 5ft above the added mass, and the alternation of the transition between the buoyancy and bare joints. The added buoyancy joint and the mass and associated hydrodynamic slick joint with fns. At diameter are not known, therefore the this location the hydrody- namic effects of buoyancy sensitivity of the curvature from the ATM and slick joints coexist. to these parameters is studied in this
Therefore, it is challeng- section.
ing to defne the correct
The sensitivity of the curvature stan- hydrodynamic properties dard deviation to added mass coeffcient for this formulation at this in the analytical transfer method is shown elevation. The standard in Figure 10. The added mass coeffcient deviation of the curvature is given as 1.0 for all riser joints in FEA, around the pipe circumfer- while it is varied between 0.5 and 2.0 in ence is compared between the analytical transfer method. The varia- the analytical transfer tion of standard deviations at six typical methodology and that from locations of the riser (A through F) is plot- the feld strain gauge. As ted against the added mass coeffcient,
Figure 7: INTEGRIstick curvature sensor mounted on shown in Figure 9, the as shown in Figure 10. Compared with slick riser joint with fns analytical transfer meth- the base case with Ca=1.0, the curvature 0.05Hz in the curvatures are fltered. standard deviation of the slick joints (A, odology matches the feld data well,
The strain gauge sensor is located considering a drag diameter of 54in and
B, C, D) increases about 3.6% for every approximately 5ft above the joint an added mass coeffcient of 1.73 for the increment of 0.1 (or 10%) in added mass interface, and the joint below this slick slick joint. coeffcient, while increases about 4.8% joint is buoyancy joint. Field added for buoyant joints (E and F).
Sensitivity and discussion mass and equivalent OD are not clearly
Measured riser tension and mud
The curvature using feld data is affected weight in the feld may not always be known, especially at the location of the
August 2014 | OE oedigital.com 94 000-OE0814_Subsea2_2H.indd 94 7/22/14 3:38 PM