
Page 33: of Offshore Engineer Magazine (Jan/Feb 2015)
Read this page in Pdf, Flash or Html5 edition of Jan/Feb 2015 Offshore Engineer Magazine
 32
32
 34
34
Geology & Geophysics for imaging sub-salt sediment struc-
GOM for Mexican operator Pemex over accumulation.
tures, where an intelligent well-con- >40 identifed prospects. Figure 1 shows the updated transverse strained attribute correlation between
In one example for Pemex, the pros- resistance (TR) map that incorporates the inverted resistivity and compressional pect was located approximately 1800m CSEM data and the extent of the resistiv- velocity in sediments can be used to below mudline and consisted of an ity anomaly associated with the target. refne the seismic velocity model and anticlinal structure situated within a It’s important to note the close spatial produce better seismic imaging for base- compressional belt, where a variety of correlation between both the seismic and ment structures. compressional structures occurred at the CSEM and the highly resistive feature
In addition, EM measures different various scales. Overlying the main struc- to the south east of the main structure rock properties to seismic and is sub- ture, a seismic sequence was present that that was interpreted as being non-hydro- sequently unperturbed by the scatter was almost devoid of faults, providing carbon related, based on the seismic and refraction that causes seismic such just enough sealing capacity for the entire indicators of resistive lithologies shown diffculties, accurately picking out the structural closure. elsewhere in the survey.
base of the salt in depth by the change of Figure 1 illustrates the regional reser- As a result of this interpretation, both resistance and then applying this to the voir interval and the initial interpretation the probability of success and reserves velocity model. that relied purely on seismic data and of this prospect were updated. The target
Whether in sub-salt felds or felds geological knowledge. It shows a reason- was then drilled and encountered two with other geological characteristics, able conformance with the structural hydrocarbon-flled reservoir intervals, integrating EM data into the exploration closure and an association with anoma- thereby confrming the interpretation workfow to support seismic allows for a lous seismic amplitudes. A white line derived from the 3D CSEM data working better classifcation of prospects through polygon also shows the extent of the alongside the 3D seismic and the regional the downgrading or upgrading of the seismic anomaly. The main risk here is geology.
probability of fnding hydrocarbons and the hydrocarbon saturation/seal, as the 3D CSEM in salt an improvement in the evaluation of the column height is quite large.
size of the accumulation. In the 3D CSEM inversion data, an The applicability of CSEM when it comes
Rv anomaly is present that has a good to salt can also be seen in another target 3D CSEM in the Gulf of Mexico ft with the seismic amplitudes within in the deepwater GOM. In this case, con-
EMGS has a long history of conducting the structural closure and reduces the ducting a resistivity survey through EM
CSEM surveys in the GOM. risk of low saturation being the origin of and then incorporating the reinterpreted
Since 2010, EMGS has acquired over the derived seismic amplitudes. It also geobodies back into the seismic via 16,000sq km of 3D CSEM in the Mexican confrms the large areal extent of the migration led to signifcant benefts.
Fig. 1: Regional reservoir interval and the initial interpretation that relied purely on seismic data and geological knowledge, compared with an updated transverse resistance (TR) map that incorporates the CSEM data. Images from EMGS.
One source of such support is 3D con- trolled source electromagnetic (CSEM). 3D CSEM, when integrated with seis- mic data, can lower exploration costs and increase discovery rates in the US and
Mexican Gulf of Mexico (GOM). 3D CSEM surveys 3D CSEM data maps resistive anomalies in the subsurface, where the larger the resis- tive body, the greater the response. This is due to the electrical resistivity of the subsurface being a physical property that strongly correlates with the fuid content and saturation of hydrocarbon reservoirs.
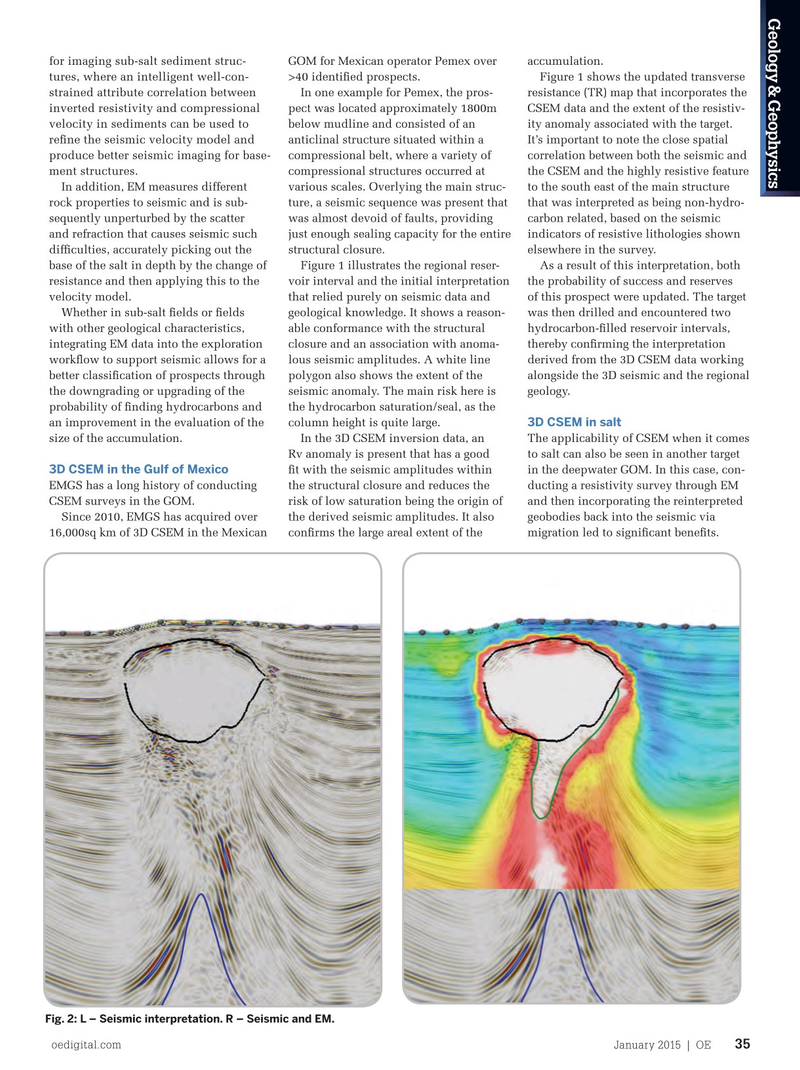
Fig. 2: L – Seismic interpretation. R – Seismic and EM.
Such EM methods are also well-suited oedigital.com January 2015 | OE 35 034_OE0115_G&G1_EMGS.indd 35 12/22/14 8:24 PM