Page 34: of Offshore Engineer Magazine (Jan/Feb 2015)
Read this page in Pdf, Flash or Html5 edition of Jan/Feb 2015 Offshore Engineer Magazine
Geology & Geophysics
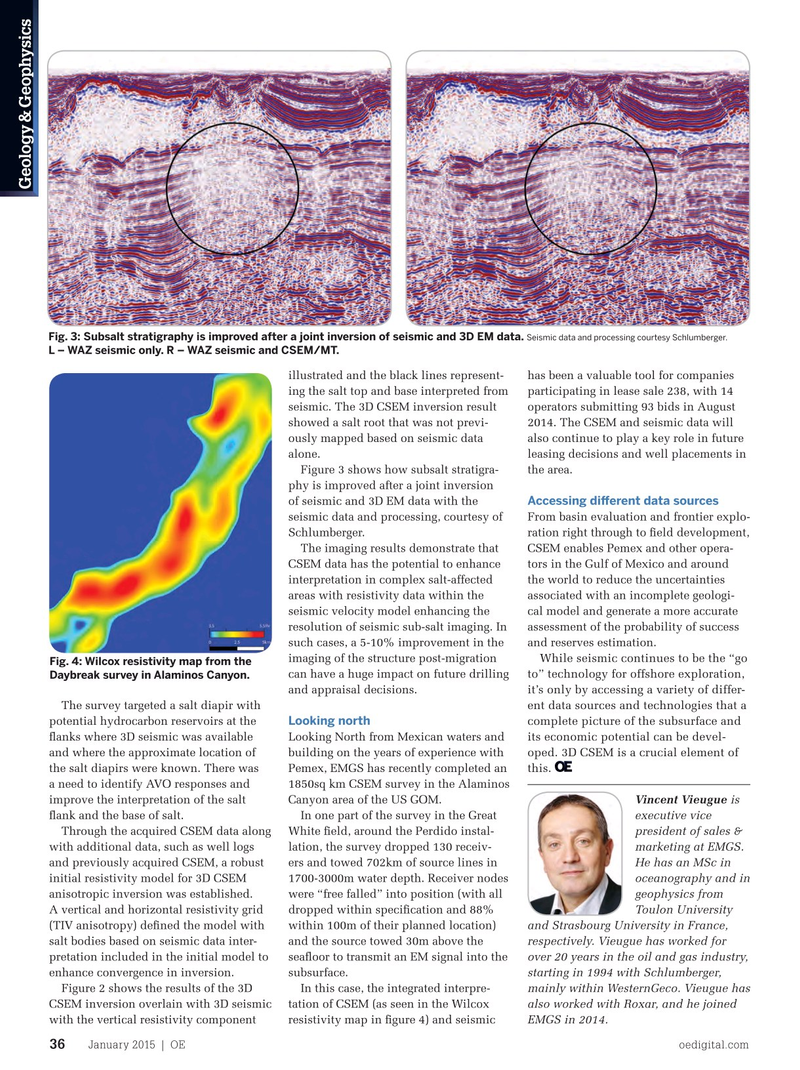
Fig. 3: Subsalt stratigraphy is improved after a joint inversion of seismic and 3D EM data.
Seismic data and processing courtesy Schlumberger.
L – WAZ seismic only. R – WAZ seismic and CSEM/MT. illustrated and the black lines represent- has been a valuable tool for companies ing the salt top and base interpreted from participating in lease sale 238, with 14 seismic. The 3D CSEM inversion result operators submitting 93 bids in August showed a salt root that was not previ- 2014. The CSEM and seismic data will ously mapped based on seismic data also continue to play a key role in future alone. leasing decisions and well placements in
Figure 3 shows how subsalt stratigra- the area. phy is improved after a joint inversion
Accessing diferent data sources of seismic and 3D EM data with the seismic data and processing, courtesy of From basin evaluation and frontier explo-
Schlumberger. ration right through to feld development,
The imaging results demonstrate that CSEM enables Pemex and other opera-
CSEM data has the potential to enhance tors in the Gulf of Mexico and around interpretation in complex salt-affected the world to reduce the uncertainties areas with resistivity data within the associated with an incomplete geologi- seismic velocity model enhancing the cal model and generate a more accurate resolution of seismic sub-salt imaging. In assessment of the probability of success such cases, a 5-10% improvement in the and reserves estimation.
While seismic continues to be the “go imaging of the structure post-migration
Fig. 4: Wilcox resistivity map from the to” technology for offshore exploration, can have a huge impact on future drilling
Daybreak survey in Alaminos Canyon.
it’s only by accessing a variety of differ- and appraisal decisions.
The survey targeted a salt diapir with ent data sources and technologies that a
Looking north potential hydrocarbon reservoirs at the complete picture of the subsurface and its economic potential can be devel-fanks where 3D seismic was available Looking North from Mexican waters and and where the approximate location of building on the years of experience with oped. 3D CSEM is a crucial element of the salt diapirs were known. There was Pemex, EMGS has recently completed an this. a need to identify AVO responses and 1850sq km CSEM survey in the Alaminos improve the interpretation of the salt Canyon area of the US GOM. Vincent Vieugue is fank and the base of salt. In one part of the survey in the Great executive vice
Through the acquired CSEM data along White feld, around the Perdido instal- president of sales & with additional data, such as well logs lation, the survey dropped 130 receiv- marketing at EMGS. and previously acquired CSEM, a robust ers and towed 702km of source lines in He has an MSc in initial resistivity model for 3D CSEM 1700-3000m water depth. Receiver nodes oceanography and in anisotropic inversion was established. were “free falled” into position (with all geophysics from
A vertical and horizontal resistivity grid dropped within specifcation and 88% Toulon University (TIV anisotropy) defned the model with within 100m of their planned location) and Strasbourg University in France, salt bodies based on seismic data inter- and the source towed 30m above the respectively. Vieugue has worked for pretation included in the initial model to seafoor to transmit an EM signal into the over 20 years in the oil and gas industry, enhance convergence in inversion. subsurface. starting in 1994 with Schlumberger,
Figure 2 shows the results of the 3D In this case, the integrated interpre- mainly within WesternGeco. Vieugue has
CSEM inversion overlain with 3D seismic tation of CSEM (as seen in the Wilcox also worked with Roxar, and he joined with the vertical resistivity component resistivity map in fgure 4) and seismic EMGS in 2014.
January 2015 | OE oedigital.com 36 034_OE0115_G&G1_EMGS.indd 36 12/22/14 8:25 PM

 33
33

 35
35