
Page 31: of Offshore Engineer Magazine (Feb/Mar 2015)
Read this page in Pdf, Flash or Html5 edition of Feb/Mar 2015 Offshore Engineer Magazine
 30
30
 32
32
environment could last as long as two years, from 2H 2014 Weak demand growth for ? oating production units will keep through 1H 2016. And a low oil price (sub $80/bbl Brent) does the orderbook relatively ? at for the next several years. Floating, not bode well for the offshore industry. production, storage and of? oading units will continue to con-
In the Gulf of Mexico (GOM), additional post-Macondo tribute 40%-60% of all new investment activity.
safety requirements – which are the primary driver behind a Meanwhile, offshore support vessels, which saw an uptick 13% longer time to drill – are escalating costs for projects in in newbuilds in 2014, will expand the existing ? eet by almost deepwater. It is worth pointing out that there has been a 25% 5%. Growth will be scaled back to a more modest 2%-3% per increase in cost in the GOM since 2010. While some of this annum growth in 2015 and 2016. increase undeniably is a result of more strict regulations, there The total mobile offshore ? eet is projected to grow by nearly is a portion of that 25% increase that is due to the escalating 1400 units by yearend. With offshore support vessels included cost of skilled workers. Operators in the GOM are competing in the number, the total offshore mobile ? eet is projected to for workers with operators developing shale projects onshore, grow 4.8% to 8869 units by year end, with an additional 17% where ? eld workers have the bene? t of spending more time growth by the end of 2020.
with their families. Despite the cost increases, however, drilling
Looking ahead in the GOM remains attractive in comparison to other parts of the world because of the potential for pro? t. There are many Volatility is inherent to the oil and gas industry; so it comes as petroleum-rich nations from the Middle East to Latin America no surprise that the long climb upward in oil prices has come to that continue to limit the amount of pro? t energy companies an abrupt halt. The reversal in oil prices, while dramatic, is not can make. a show stopper for exploration and development, but it repre-
Overall, the picture that comes into focus for the next sents a signi? cant obstacle in the near term, and it will be quite 18-24 months is one of weaker new investment. The pro- some time before there is another oil price reversal that will jected low oil price environment will have the greatest be sustained long enough to encourage an increase in offshore impact on deepwater, ultra-deepwater and harsh environ- exploration and production activity. ment projects, which have a higher oil price threshold for
James Graf is ABS Corporate Vice viability. The knock-on effect also will impact new invest-
President of Business Planning and ment in offshore production units and offshore support
Analysis, based in New York, where he vessels.
has responsibility for global business
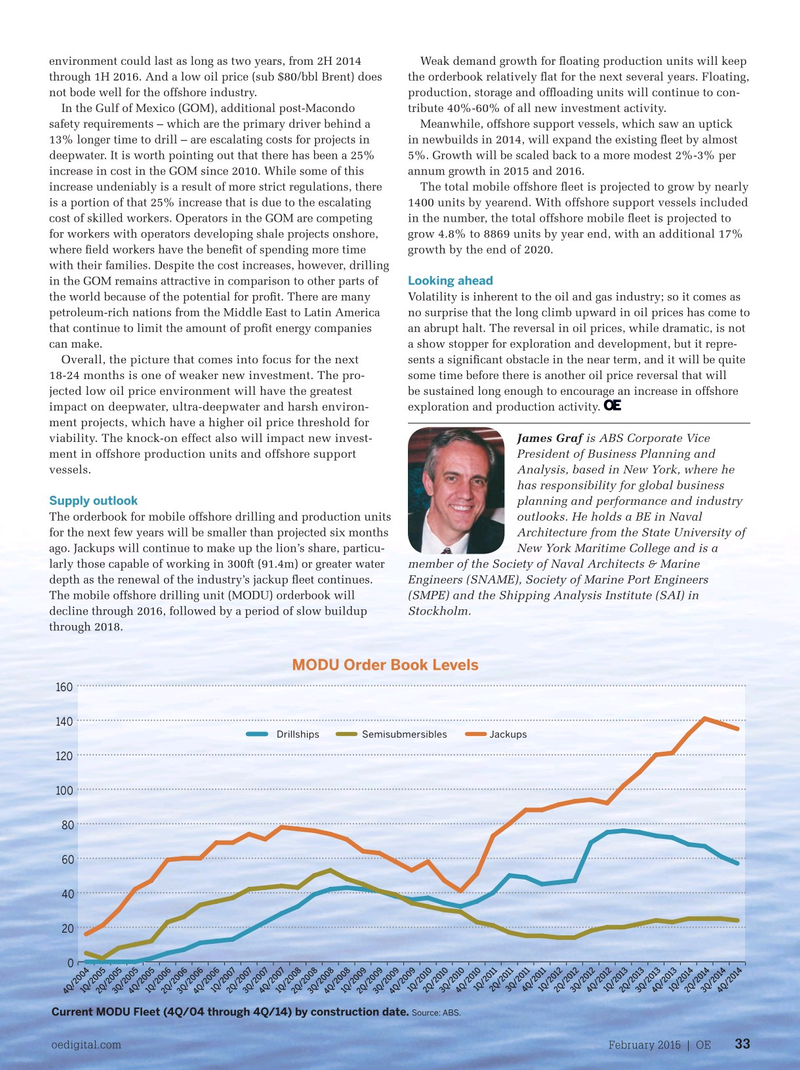
Supply outlook planning and performance and industry
The orderbook for mobile offshore drilling and production units outlooks. He holds a BE in Naval for the next few years will be smaller than projected six months
Architecture from the State University of ago. Jackups will continue to make up the lion’s share, particu-
New York Maritime College and is a larly those capable of working in 300ft (91.4m) or greater water member of the Society of Naval Architects & Marine depth as the renewal of the industry’s jackup ? eet continues.
Engineers (SNAME), Society of Marine Port Engineers
The mobile offshore drilling unit (MODU) orderbook will (SMPE) and the Shipping Analysis Institute (SAI) in decline through 2016, followed by a period of slow buildup
Stockholm.
through 2018.
MODU build date
MODU Order Book Levels distribution – by numbers 160 (4Q/14) 140 200
Drillships Semisubmersibles Jackups
Drillships Semisubmersibles 120
Jackups 150 100 80 100 60 40 50 20 0 0 pre- 1970-1975-1980-1985- 1990-1995-2000-2005-2010- 1969 1974 1979 1984 1989 1994 1999 2004 2009 2014 1Q/2011 1Q/2012 2Q/2011 1Q/2013 3Q/2011 1Q/2014 1Q/2010 4Q/2011 2Q/2012 1Q/2007 2Q/2013 3Q/2012 3Q/2013 2Q/2014 3Q/2014 2Q/2010 3Q/2010 4Q/2012 4Q/2013 1Q/2005 4Q/2014 1Q/2008 1Q/2009 4Q/2010 1Q/2006 2Q/2007 3Q/2007 4Q/2007 2Q/2005 3Q/2005 2Q/2008 2Q/2009 2Q/2006 3Q/2008 3Q/2009 3Q/2006 4Q/2005 4Q/2008 4Q/2009 4Q/2006 4Q/2004
Distribution of current MODU ? eet through 4Q/14.
Current MODU Fleet (4Q/04 through 4Q/14) by construction date. Source: ABS.
Source: ABS.
oedigital.com February 2015 | OE 33 032_OE0215_Rigmarket_ABS.indd 33 1/20/15 6:12 PM