
Page 11: of Offshore Engineer Magazine (Jan/Feb 2019)
FPSO/FNLG Outlook and Technologies
Read this page in Pdf, Flash or Html5 edition of Jan/Feb 2019 Offshore Engineer Magazine
 10
10
 12
12
LEADING OFF Visualization Technology achieved 0.67mm error, from a two-minute scan, Tidball said.
Tidball said the system could negate the need for long base- line (LBL) systems, for positioning accuracy, but said visibil- ity was a factor, for the cameras to work. While the technology is able to position the ROV or AUV within its environment, if it was moving to another site, and was tetherless, inertial naviga- tion would be needed.
Back to the future
The techniques used to create point clouds on the ? y can also be used to create point clouds from existing images or video footage, said Dr. Martin Sayer, managing director at
Scotland-based Tritonia Scienti? c. As an example, Tritonia used its technology as part of a net environmental bene? t analysis of a platform jacket in a tropical location, where an
FAST PIPELINE operator wanted to determine how much extra weight marine growth would add to a jacket, for lifting operation calcula- tions and onshore disposal planning. Tritonia was given ex-
INSPECTION isting ROV footage to assess. This had been taken for ? sh life surveys, not jacket biofouling, so it was not designed or
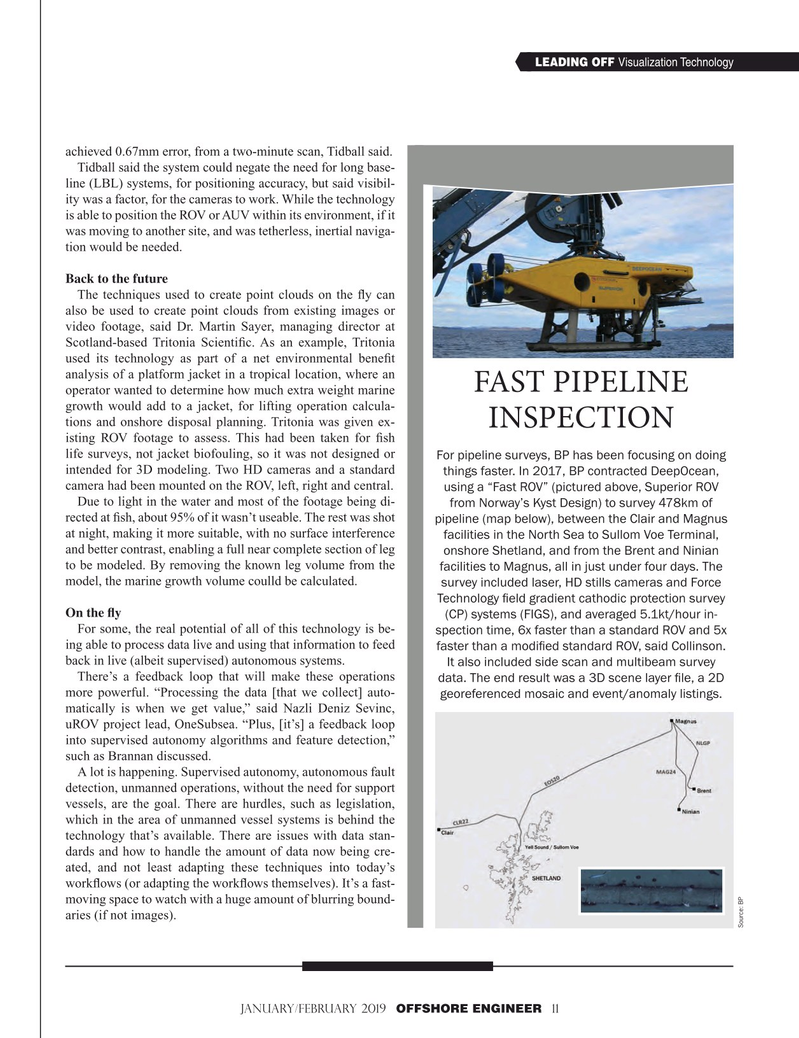
For pipeline surveys, BP has been focusing on doing intended for 3D modeling. Two HD cameras and a standard things faster. In 2017, BP contracted DeepOcean, camera had been mounted on the ROV, left, right and central. using a “Fast ROV” (pictured above, Superior ROV
Due to light in the water and most of the footage being di- from Norway’s Kyst Design) to survey 478km of rected at ? sh, about 95% of it wasn’t useable. The rest was shot pipeline (map below), between the Clair and Magnus at night, making it more suitable, with no surface interference facilities in the North Sea to Sullom Voe Terminal, and better contrast, enabling a full near complete section of leg onshore Shetland, and from the Brent and Ninian to be modeled. By removing the known leg volume from the facilities to Magnus, all in just under four days. The model, the marine growth volume coulld be calculated. survey included laser, HD stills cameras and Force
Technology ? eld gradient cathodic protection survey
On the ? y (CP) systems (FIGS), and averaged 5.1kt/hour in-
For some, the real potential of all of this technology is be- spection time, 6x faster than a standard ROV and 5x ing able to process data live and using that information to feed faster than a modi? ed standard ROV, said Collinson. back in live (albeit supervised) autonomous systems.
It also included side scan and multibeam survey
There’s a feedback loop that will make these operations data. The end result was a 3D scene layer ? le, a 2D more powerful. “Processing the data [that we collect] auto- georeferenced mosaic and event/anomaly listings.
matically is when we get value,” said Nazli Deniz Sevinc, uROV project lead, OneSubsea. “Plus, [it’s] a feedback loop into supervised autonomy algorithms and feature detection,” such as Brannan discussed.
A lot is happening. Supervised autonomy, autonomous fault detection, unmanned operations, without the need for support vessels, are the goal. There are hurdles, such as legislation, which in the area of unmanned vessel systems is behind the technology that’s available. There are issues with data stan- dards and how to handle the amount of data now being cre- ated, and not least adapting these techniques into today’s work? ows (or adapting the work? ows themselves). It’s a fast- moving space to watch with a huge amount of blurring bound- aries (if not images).
Source: BP
January/February 2019 OFFSHORE ENGINEER 11 1-17 OE 2019.indd 11 1-17 OE 2019.indd 11 1/21/2019 3:59:48 PM1/21/2019 3:59:48 PM