
Page 15: of Offshore Engineer Magazine (Mar/Apr 2024)
Read this page in Pdf, Flash or Html5 edition of Mar/Apr 2024 Offshore Engineer Magazine
 14
14
 16
16
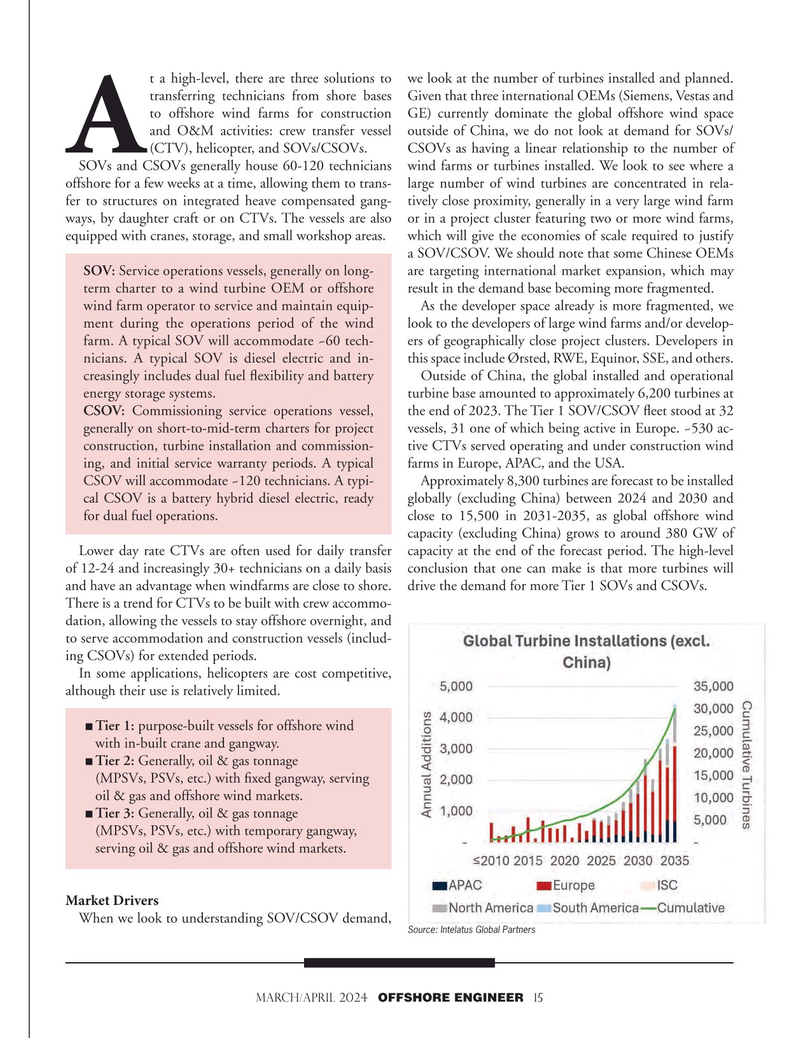
t a high-level, there are three solutions to we look at the number of turbines installed and planned. transferring technicians from shore bases Given that three international OEMs (Siemens, Vestas and to offshore wind farms for construction GE) currently dominate the global offshore wind space and O&M activities: crew transfer vessel outside of China, we do not look at demand for SOVs/
A (CTV), helicopter, and SOVs/CSOVs. CSOVs as having a linear relationship to the number of
SOVs and CSOVs generally house 60-120 technicians wind farms or turbines installed. We look to see where a offshore for a few weeks at a time, allowing them to trans- large number of wind turbines are concentrated in rela- fer to structures on integrated heave compensated gang- tively close proximity, generally in a very large wind farm ways, by daughter craft or on CTVs. The vessels are also or in a project cluster featuring two or more wind farms, equipped with cranes, storage, and small workshop areas. which will give the economies of scale required to justify a SOV/CSOV. We should note that some Chinese OEMs
SOV: Service operations vessels, generally on long- are targeting international market expansion, which may term charter to a wind turbine OEM or offshore result in the demand base becoming more fragmented. wind farm operator to service and maintain equip- As the developer space already is more fragmented, we ment during the operations period of the wind look to the developers of large wind farms and/or develop- farm. A typical SOV will accommodate ~60 tech- ers of geographically close project clusters. Developers in nicians. A typical SOV is diesel electric and in- this space include Ørsted, RWE, Equinor, SSE, and others.
creasingly includes dual fuel fexibility and battery Outside of China, the global installed and operational energy storage systems. turbine base amounted to approximately 6,200 turbines at
CSOV: Commissioning service operations vessel, the end of 2023. The Tier 1 SOV/CSOV feet stood at 32 generally on short-to-mid-term charters for project vessels, 31 one of which being active in Europe. ~530 ac- construction, turbine installation and commission- tive CTVs served operating and under construction wind ing, and initial service warranty periods. A typical farms in Europe, APAC, and the USA.
CSOV will accommodate ~120 technicians. A typi- Approximately 8,300 turbines are forecast to be installed cal CSOV is a battery hybrid diesel electric, ready globally (excluding China) between 2024 and 2030 and for dual fuel operations. close to 15,500 in 2031-2035, as global offshore wind capacity (excluding China) grows to around 380 GW of
Lower day rate CTVs are often used for daily transfer capacity at the end of the forecast period. The high-level of 12-24 and increasingly 30+ technicians on a daily basis conclusion that one can make is that more turbines will and have an advantage when windfarms are close to shore. drive the demand for more Tier 1 SOVs and CSOVs.
There is a trend for CTVs to be built with crew accommo- dation, allowing the vessels to stay offshore overnight, and to serve accommodation and construction vessels (includ- ing CSOVs) for extended periods.
In some applications, helicopters are cost competitive, although their use is relatively limited.
¦Tier 1: purpose-built vessels for offshore wind with in-built crane and gangway.
¦Tier 2: Generally, oil & gas tonnage (MPSVs, PSVs, etc.) with fxed gangway, serving oil & gas and offshore wind markets.
¦Tier 3: Generally, oil & gas tonnage (MPSVs, PSVs, etc.) with temporary gangway, serving oil & gas and offshore wind markets.
Market Drivers
When we look to understanding SOV/CSOV demand,
Source: Intelatus Global Partners
MARCH/APRIL 2024 OFFSHORE ENGINEER 15