
Evolution of Ocean Exploration: Mapping the Seafloor with Geodesy
By Kira Coley
The evolution of ocean exploration continues with seafloor mapping with Geodesy.
In an age where the surface of Mercury and Mars can be mapped in great detail, it’s difficult to imagine how around 85-95 percent of our ocean floor remain enigmatic. While advanced sonar technology has allowed ships to create highly detailed topographic maps, it would take 125-200 ship-years to survey the deep oceans alone, costing billions of dollars. Gravity models are powerful tools for charting large areas of the ocean where tectonic structures and deep ocean basins remain unmapped by ships or hidden under thick sediment.
Now, the new marine gravity model announced by a team of international scientists’ shows unprecedented resolution of the seafloor uncovering several new tectonic features. It is an exciting time for ocean exploration as each new year reveals more of the uncharted oceans, catalyzing new developments in plate tectonics, navigation, petroleum exploration and earthquake forecasting.
While ship-based surveys remain a vital and valuable tool, topographic mapping is limited by the number of ship crossings. As such, only around 11 percent of the seafloor has been mapped at high resolution and 17 percent at lower resolution to date. In 1978, NASA’s Seasat altimeter was the first to demonstrate the ability to gather seafloor bathymetry from space.
“When I was a graduate student I worked on Seasat, which was a NASA altimeter satellite,” said David Sandwell, Scripps Institution of Oceanography. “When the data came out from Seasat everyone realized that the data we were looking at looked like the ocean floor – we were looking at the ocean surface topography, but it looks like the seabed. That was probably then we realized we could use gravity field data to map the ocean floor.”
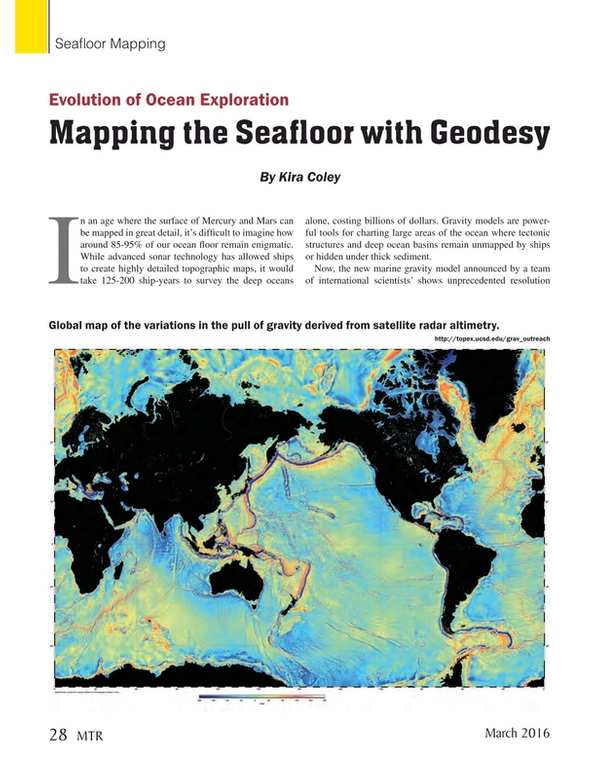
The broad bumps and dips of the ocean surface mimics the topography of the seabed. The extra gravitational attraction of features on the seafloor produces minor variations in the pull of gravity that produce tiny variations in ocean surface height. These bumps and dips can be mapped using a very accurate radar altimeter mounted on a satellite.
For decades, David Sandwell from the Scripps Institution of Oceanography and Walter Smith from the National Oceanic and Atmospheric Administration (NOAA) have been using Earth’s gravity field data from the civilian and military satellite operators. By combining new radar altimeter measurements from satellites such as the European Space Agency’s (ESA) CryoSat-2 and NASA CNES Jason-1 with existing data, a global marine gravity model was constructed that is two times more accurate than previous models. The team of scientists included R. Dietmar Müller from the University of Sydney, EmmanuelGarcia of NOAA and Richard Francis from ESA. The data they collected regarding gravity measurements and sea surface heights have formed unprecedented detailed maps of beneath the oceans’ surfaces.
“We’ve been doing this for a longtime – at first we got data from a satellite called Geosat which was a U.S. Navy satellite launched in 1985. A breakthrough in altimeter coverage became available in 1995 when the United States Navy declassified the data from their mapping missions. The next big breakthrough was the CryoSat-2 ESA, which maps of the changing topography of the icecaps and over the ocean. It’s really a wonderful platform because it has better accuracy and coverage than all previous altimeters,” said Sandwell.
Global maps constructed using satellite-derived gravity data will never replace the ships. The resolution of this new method is limited by the ocean depth because the potential field which gets smooth as you go from the bottom of the ocean to the surface. Whereas, the standard ship-based multibeam echo-sounders resolves features on the seafloor in high resolution about 100 meters across. The problem is in our lifetime we will probably never see the complete mapping of the seafloor by ships. Which makes the satellite data vital to filling in the gaps.
The main challenges scientists face in developing these gravity field models is improving the resolution from the satellite altimetry data. Sea surface topography is a noisy measurement as the waves roughen the ocean’s surface making the range measurement less precise.
The Age of Charted Oceans
The two big areas of discoveries this model has already uncovered is found on the flanks of the seafloor spreading ridges; there’s a fabric called the Abyssal Hills. These hills are parallel to the spreading ridge and were yet to be resolved in the old gravity fields. “These hills are important because when the water moves across the bottom of the oceans due to the tides, it hits the hills generating ‘internal waves’. These internal waves propagate up and mix the ocean, keeping the ocean from always being warm on top and freezing on the bottom. So, understanding where theses hills are and how they interact with the tides is important and a big science project,” said Sandwell.
The second big area is at the continental margins, which is where the plates split apart during rifting, forming fracture zones and transform faults. These are locations typically buried under sediments on the fl anks of the continental margins, making them difficult to detect using ships. This new data allows researchers to see the fracture zones under the sediment which can be used in detailed plate tectonics as well as identifying sedimentary basins when searching for oil.
Ocean Exploration with Marine Gravity Models
One the real uses of the gravity field for seafloor mapping is identifying features that are unmapped, but also big in size such as large sea mounts and other structures. This allows researchers and commercial operators to target ship surveys to complete detailed mapping.
“The original reason these altimeters were launched by the U.S. Navy was to map out the variations in the pull of gravity their effects on moving platforms. The military applications are obvious and provided the rationale for the $80 million cost of the Geosat mission,” said Sandwell. “When you’re in a submarine you can’t use your GPS because you’re under the water, so you use these precise accelerometers to measure your trajectory but you also have to know the gravity field, otherwise you might think you’re turning but you’re actually going straight. It’s called ‘inertial navigation’. Aircrafts also use this.” The global gravity grids also revealed half of all volcanoes on the seafloor reaching heights greater than 1000m, which were previously uncharted. The large petroleum exploration companies also use satellite altimeter gravity data from Geosat and ERS-1 to locate offshore sedimentary basins in remote areas. This information is combined with reconnaissance surveys to determine where to collect or purchase multi-channel seismic survey data.
Evolving Marine Gravity Models
The project is still evolving and the interpretation of the results is yet to be completed. As these gravity fields are developed, the fine detailed of tectonic structures formed up to 150 million years ago will need to be interpreted. The objectives of this work will be to unravel the marine tectonics environments and other types of data that needs to be combined into current models.
“In terms of improvements to the marine gravity models, CryoSat is still up there and will run till at least 2017 hopefully – and every year of data it gives us another improvement in the resolution of the gravity fields so that’s good. There’s another altimeter up there launched by the French and the Indians called SARAL which has improved technology with better resolution than CryoSat. It’s a slow process but over the years the gravity resolution will improve,” said Sandwell. “Also, there is not a good global compilation of ship mapping locations or data, because it is done by dozens of different countries and companies. The big improvement would be to assemble all the data that’s ever been collected and figure out where the holes are so we can go out systematically and map them.”
In January 2016, Google replaced its global seafloor map with an improved version constructed using the latest gravity predictions and the available multibeam sounding data. NASA has a planned swath altimeter mission, SWOT, scheduled for a launch in 2020, that could provide another factor of 5 improvement in global ocean floor bathymetry.
Satellite technology is always evolving, helping scientists follow the movements of Earth’s tectonic plates over time and target areas to study further using sonar scanning. While the increased use of non-invasive methods promise a more environmental friendly future, the continuous discoveries of new seafloor features in deep-sea marine territories marks a huge milestone in understanding our planet.
Acknowledgements
Professor David Sandwell, Scripps Institution of Oceanography
The Author
Kira Coley graduated with a BSc. (Hons) Marine Biology degree from University of Portsmouth and has extensive experience as a Field Scientist in various locations.
(As published in the March 2016 edition of Marine Technology Reporter: http://www.marinetechnologynews.com/magazine)
Read Evolution of Ocean Exploration: Mapping the Seafloor with Geodesy in Pdf, Flash or Html5 edition of Mar/Apr 2016 Marine Technology