Full-Depth Current Profiling Around the Global Ocean
Three Decades of High Pressure for Lowered ADCPs
Introduction
Ever since the unexpected motions of the first deep-drifting floats, oceanographers have worked to lift the veil on deep currents. Direct current measurements have come in various guises. Neutrally-buoyant floats and their profiling offspring revealed deep pathways. Current meters on moorings showed changes in time. Free-falling probes allowed a profile view—closely-spaced measurements showing water current velocity versus depth. And lowered ADCPs (LADCP) have provided well-resolved, full-depth current profiles since the early 1990s.
Deep currents store, carry, and redistribute important properties for life in and out of the sea. For example, oxygen and nutrient levels are vital where the deep waters upwell to supply the ocean’s food chain. Yet until the mid-1970s, deep currents rivaled the dark side of the moon for mystery. Stimulated by findings from improved observations, there is now intense interest in how deep currents take part in the global climate system. Especially important are the changing heat and CO2 content of the deep ocean.
Methods for observing the deep sea below the upper seasonal layer are established. For measuring deep currents, scientists worldwide attach compact ADCPs to hydrographic packages. These packages are routinely lowered to the seabed to catch water samples and to measure water properties.
In this report we look at various findings from LADCP work around the global ocean. LADCP measurements were initially looking at deep currents in equatorial regions and in tropical and subtropical oceans. Features included deep currents, undercurrents, and eddies. More recently, LADCPs have supported scientific studies at high latitudes, such as exploring overturning circulations in the subpolar N. Atlantic and calculating widespread intense mixing in the Southern Ocean.
Hydrography
Ship-based hydrography measures water properties from the surface to the seabed. Results come from lowering a continuous-profiling CTD and collecting discrete water samples. These “hydro” casts are unrivaled for observing the deep ocean—especially below 2000 m. At the same time, this method also reveals hot-spots for atmospheric exchange with the ocean.
The hydrographic data see wide-ranging uses. Their span includes ocean properties, processes, and pathways. Long-term records exist for carbon components, nutrients, freshwater, heat, and more. These records reveal oceanic changes attributed to atmospheric trends—global warming and enhanced CO2 levels.
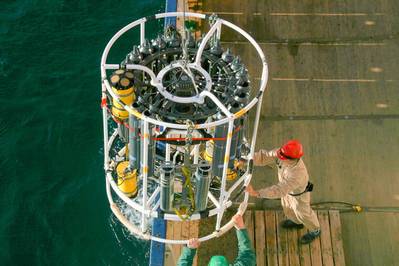
Fig. 2: Up- and down-looking Teledyne RDI ADCPs (colored yellow for highpressure rating) are attached to a hydrographic package. Credit: T. Wasilewski (IFM Hamburg). https://goo.gl/q7XGKK
Velocity Profiling
Vertical profiles of water current velocity and shear show how water moves and mixes. They help describe how water properties change and disperse. These properties include heat and energy as well as organisms, nutrients, chemicals, debris, and pollutants.
For studying deep currents, scientists want velocity profiles to have long reach yet keep a fine-scale view of how currents change with depth. This data type has revealed ocean facets from internal waves to jets, eddies, and undercurrents. And the information is widely used, from scientific discovery to operations aboard offshore rigs.
Before ADCPs, velocity profiling needed specialized teams and tools. Their use of ship time and non-recoverable equipment made the measurements expensive. Scientists sought a method that was more economical, easier to use, and available to a wider audience.
Over several years, a handful of experts adapted ADCPs to meet this demand. They devised the LADCP method and processing (https://goo.gl/1TGXBn). Key input came from staff at the University of Hawaii and Lamont Doherty Geological Observatory in USA and IFM Kiel in Germany.
Lowered ADCP Method
Deep current profiling measures below the acoustic range of ship-mounted profilers. Attached to a lowered hydrographic package, compact self-contained ADCPs pass through the water column. During descent and ascent, the ADCP continues to measure current profiles with ranges to 100 m. Later these short segments—with their fine-scale vertical resolution—are stitched together to produce a full-depth profile.
Careful processing of LADCP data incorporates various inputs. Current profiles from ship-mounted ADCPs are used to validate LADCP profiles where they overlap. Corrections are made for ship’s drift and the varying attitude and motions of the lowered package. Near the bottom of the cast, acoustic echoes scattered by the seabed reveal the ADCP’s motion. Often, dual ADCPs are used—looking up and down.
One key advantage of the LADCP method is that it does not add to ship time and running costs; the velocity profile is completed during scheduled hydro casts. Specialized technicians are not required although successfully operating the LADCP entails training and diligence. The ADCP’s compass should be calibrated carefully.
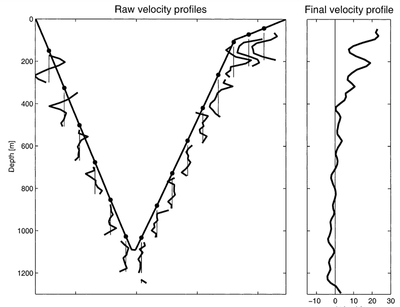
Fig. 3: ADCP profiles are stitched to form a full-depth profile. Speed (cm/s). Credit: M. Visbeck (GEOMAR, 2002). https://goo.gl/kftcJ3
Winds of Change
Adding ADCPs to hydro casts caused a sea change. Deep current profiling was available to a much larger community. Data collection was regular and widespread. And supplementary information about deep currents informed other studies, such as tracer measurements.
LADCPs gained traction on hydrographic cruises during the World Ocean Circulation Experiment (WOCE, 1990-2002). By the early 2000s, improved LADCP data quality came from improved methods of measurement and processing. And the last two decades have seen routine use of the LADCP method around the global ocean.
Extensive collections of these full-depth measurements are available. And accumulating LADCP sections from many cruises opened the door to statistical descriptions. In short, LADCPs provide a unique and developing view for studying the global ocean—from large-scale circulation to small-scale mixing.
Deep Undercurrents
A key motivation for knowing more about deep currents is to clarify the global thermohaline circulation. Along the western edge of all major ocean basins, narrow, swift undercurrents have been observed at depth. They have distinct water properties and flow counter to strong surface currents.
Using LADCPs off southern Africa, UK scientists identified an unknown undercurrent. The substantial Agulhas Undercurrent, which surprisingly is not evident in hydro data, flows equatorward at 1200 m depth. Found alongside the continental slope, this deep current carries ten times the volume of the world’s largest river. Later studies confirmed the Undercurrent’s discovery and its unexpected water properties.
Many of these undercurrents hug the steep topography of the continental slope. At these sites, full-depth LADCP profiles can be especially valuable. Over steep slopes, transport estimates for deep currents calculated from the density field can be low caused by gaps in the data. LADCP currents provide a solution.
Furthermore, LADCP data are 2-D velocity vectors—not just the cross-track component. This difference becomes more important where the hydro section cuts the current field at an oblique angle.
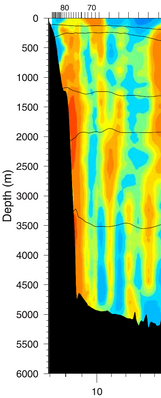
Fig. 4: Deep undercurrent flowing equatorward (orange) along a steep continental slope. Units: Depth(m), Distance(deg). Credit: Hall et al. (2004) https://goo.gl/4QB6xs
Deep-reaching Currents
The UK scientists also found LADCP stations helpful offshore of the Undercurrent. The velocity signal of the main Agulhas Current persists to great depth. Deep flows without shear are not evident in currents calculated from hydrographic sections. As a result, the traditional method can underestimate water volumes transported by deep-reaching currents. Addressing this issue was a common early use of LADCP data.
Farther north in the Indian Ocean, impressive oceanic changes follow the onset of the southwest monsoon. A well-known reversal of strong surface currents occurs in the Somali Current. Stacked jets of currents with opposing directions are found at depth. In addition, a large intense gyre spins up off Somalia over a month’s duration. Called the Great Whirl, the gyre reaches 500 km wide. It persists for three months and then dissipates as fast as it spun up.
An impressive feature of the Great Whirl is its deep extent to 3000 m. US scientists collected LADCP data on two visits separated by 3 months during WOCE. The depth of the Great Whirl’s currents increased from 200 m to 2500 m. Due to the deep reach of these currents, the volume of water moving in the Great Whirl matches the flow of the Gulf Stream off Cape Hatteras. The deep reach of the Great Whirl is one proposed explanation for reversals in the abyssal circulation below. These too were observed with LADCPs.
Data Blending
Oceanographers explored new ways to merge the LADCP information with water properties observed during the hydro casts. Ocean currents transfer water properties. For a closed region, the exchange of water properties must satisfy conservation laws, such as mass conservation. An analysis technique called inverse modeling blends different data types subject to these laws.
Away from coasts, slowly-changing currents can largely be described by the hydrographic data. But the interpretation can be equivocal due to subjective choices about deep motions. When added to an inverse model, the LADCP data constrain possible solutions for the missing deep currents.
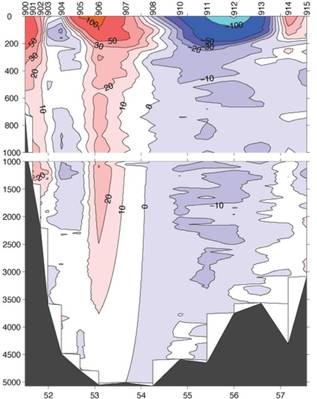
Fig. 5: LADCP data show the deep extent of the Great Whirl, a large intense gyre off Somalia.Units: Depth(m), Distance(deg). Credit: T. Chereskin (Scripps Inst. Oceanography) https://goo.gl/WsmhuV
Long-Term Sections
For two decades, German researchers have monitored boundary currents off Canada at 53°N. Across their persistent section defined by 3–5 moorings, the scientists repeated 12–15 LADCP stations during 13 cruises. As a result, data from 150 LADCP stations supplemented the moorings to describe the overturning contribution from the Labrador Sea. Strong currents were seen at various levels. In particular, the LADCP data showed a high-speed core near the deep-sea floor. Its waters had originated in the Nordic Seas.
Full-depth LADCP profiles are well-resolved vertically and can have finer horizontal spacing than a moored array. The flexibility of LADCP locations allows better definition of the inner and outer edges of the boundary current. Thus scientists can calculate more accurate transports from moored data. At 53°N, the boundary current was 120 km wide and had stable spatial structure. The volume of deep water exported southward was 30 million cubic meters per second—about the same as transport through the Florida Straits to supply the Gulf Stream.
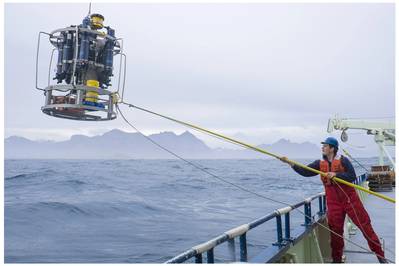
Fig. 6: Hydrographic package with dual Teledyne RDI ADCPs (yellow) in action off Greenland. Credit: C. Nobre (WHOI). https://goo.gl/HJLq5m
Ocean-Wide Sections
An ongoing multi-year, international research initiative is titled Overturning in the Subpolar N. Atlantic Program (OSNAP). Working across the width of the Atlantic at high northern latitudes, OSNAP includes many researchers with prior programs in the region. Their joint focus is ocean-wide transport of heat and freshwater as part of the global climate system.
A recent report described two crossings of a composite ocean-wide hydrographic section, observed in 2014 and 2016. The sections span several basins that show strong boundary currents. Results for the deep velocity field merged currents from the density field with a deep reference velocity from LADCP data.
The researchers noted that the LADCP data are particularly valuable in narrow boundary currents and undercurrents. Accurately measuring these features relies on high horizontal resolution; they tend to be underestimated and underresolved by satellite-based options. In fact, the report quantified this discrepancy for the combined transport of deep undercurrents around the subpolar gyre.
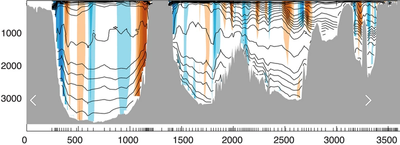
Fig. 7: Ocean-wide section of north/south currents in Subpolar N. Atlantic in 2016. Currents: North(red), South(blue). Units: Depth(m), Distance(km). Credit: Holliday et al. (2018) https://goo.gl/3YAE8X
Estimates of Mixing in the Ocean
Scientists also tapped LADCP profiles for looking at internal waves. More specifically, they wanted to quantify the effects of internal wave breaking.
Motivating this effort was a desire for more data about mixing in the ocean. Mixing had been theorized to be a significant factor in maintaining the ocean’s thermal profile. Yet studies of mixing in the ocean had been limited to a few specialized teams and tools. And those results could not be extrapolated to represent the global ocean.
In the late 1990s, scientists tested the shear from LADCP profiles as input to a statistical description of mixing in the ocean. The method blended the velocity shear with complementary data from concurrent CTD profiles. For calculating mixing across more widespread regions, the geographical distribution of LADCP profiles from WOCE was appealing. In particular, LADCP data were available in anticipated hot spots for mixing where experts had not measured.
The Southern Ocean was a prime target. Using the LADCP-based method, an international team reported results of widespread intense mixing near Drake Passage. High rates were seen over rough topography for thousands of kilometers. The implication is that mixing is an essential factor in the large-scale overturning circulation at high southern latitudes.
The use of LADCP data in such mixing studies has gained traction—even “exploded” per a recent paper. For example, one group of scientists proposed an alternative approach to quantify mixing. They included LADCP data from five diverse dynamic regimes: equatorial waters, East Pacific Rise, Luzon Strait, South Pacific, and Drake Passage.
Lowered ADCPs: Great Under Pressure
Velocity profiling provides a fine-scale view of how ocean currents change with depth. The method began with specialized teams and tools. Later compact ADCPs were lowered to the seabed. Over several years, a cooperative effort among experts devised and refined the LADCP method and processing.
The Lowered ADCP has spread to be a standard technique used worldwide by the ocean research community. They have used it to lift the veil on deep currents from internal waves to jets, eddies, and undercurrents. And after three decades of gathering, full-depth LADCP velocity profiles span the global ocean. They are being applied across a wide range of issues: from local to global in scope, and from days to decades in duration.
Data Credits
Fig. 3: M. Visbeck (2002) Deep velocity profiling using lowered Acoustic Doppler Current Profiler: Bottom track and inverse solutions. DOI 10.1175/1520-0426(2002)019<0794:DVPULA>2.0.CO;2
Fig. 4: M.M. Hall, T.M. Joyce, R.S. Pickart, W.M. Smethie Jr., D.J. Torres (2004), Zonal circulation across 52°W in the North Atlantic. https://doi.org/10.1029/2003JC002103
Figs.5: L. M. Beal, and K. A. Donohue (2013), The Great Whirl: Observations of its seasonal development and interannual variability. https://doi.org/10.1029/2012JC008198
Fig. 7: N.P. Holliday, S. Bacon, S.A. Cunningham, S.F. Gary, J. Karstensen, B.A. King, F. Li, E.L. Mcdonagh (2018), Subpolar North Atlantic Overturning and Gyre-Scale Circulation in the Summers of 2014 and 2016. https://doi.org/10.1029/2018JC013841
Read Full-Depth Current Profiling Around the Global Ocean in Pdf, Flash or Html5 edition of Nov/Dec 2018 Marine Technology