Page 50: of Maritime Logistics Professional Magazine (Q3 2013)
Training & Security
Read this page in Pdf, Flash or Html5 edition of Q3 2013 Maritime Logistics Professional Magazine
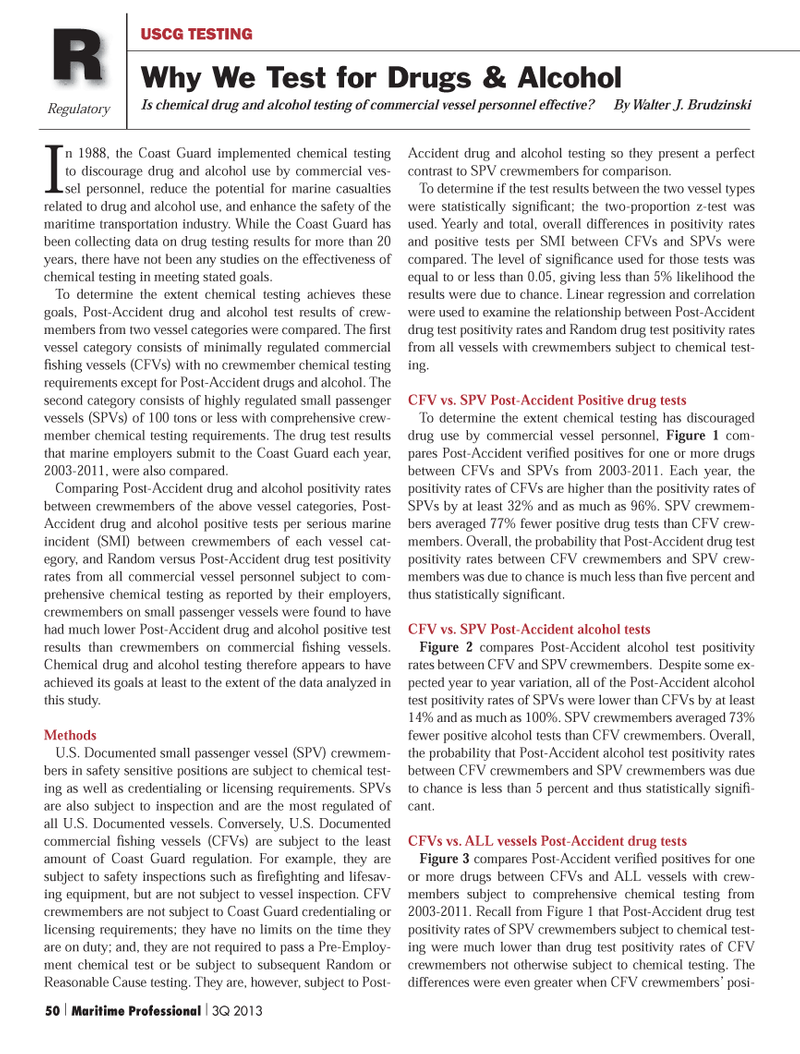
In 1988, the Coast Guard implemented chemical testing to discourage drug and alcohol use by commercial ves- sel personnel, reduce the potential for marine casualties related to drug and alcohol use, and enhance the safety of the maritime transportation industry. While the Coast Guard has been collecting data on drug testing results for more than 20 years, there have not been any studies on the effectiveness of chemical testing in meeting stated goals. To determine the extent chemical testing achieves these goals, Post-Accident drug and alcohol test results of crew- members from two vessel categories were compared. The Þ rst vessel category consists of minimally regulated commercial Þ shing vessels (CFVs) with no crewmember chemical testing requirements except for Post-Accident drugs and alcohol. The second category consists of highly regulated small passenger vessels (SPVs) of 100 tons or less with comprehensive crew- member chemical testing requirements. The drug test results that marine employers submit to the Coast Guard each year, 2003-2011, were also compared. Comparing Post-Accident drug and alcohol positivity rates between crewmembers of the above vessel categories, Post- Accident drug and alcohol positive tests per serious marine incident (SMI) between crewmembers of each vessel cat- egory, and Random versus Post-Accident drug test positivity rates from all commercial vessel personnel subject to com- prehensive chemical testing as reported by their employers, crewmembers on small passenger vessels were found to have had much lower Post-Accident drug and alcohol positive test results than crewmembers on commercial Þ shing vessels. Chemical drug and alcohol testing therefore appears to have achieved its goals at least to the extent of the data analyzed in this study. Methods U.S. Documented small passenger vessel (SPV) crewmem- bers in safety sensitive positions are subject to chemical test- ing as well as credentialing or licensing requirements. SPVs are also subject to inspection and are the most regulated of all U.S. Documented vessels. Conversely, U.S. Documented commercial Þ shing vessels (CFVs) are subject to the least amount of Coast Guard regulation. For example, they are subject to safety inspections such as Þ reÞ ghting and lifesav- ing equipment, but are not subject to vessel inspection. CFV crewmembers are not subject to Coast Guard credentialing or licensing requirements; they have no limits on the time they are on duty; and, they are not required to pass a Pre-Employ- ment chemical test or be subject to subsequent Random or Reasonable Cause testing. They are, however, subject to Post- Accident drug and alcohol testing so they present a perfect contrast to SPV crewmembers for comparison. To determine if the test results between the two vessel types were statistically signiÞ cant; the two-proportion z-test was used. Yearly and total, overall differences in positivity rates and positive tests per SMI between CFVs and SPVs were compared. The level of signiÞ cance used for those tests was equal to or less than 0.05, giving less than 5% likelihood the results were due to chance. Linear regression and correlation were used to examine the relationship between Post-Accident drug test positivity rates and Random drug test positivity rates from all vessels with crewmembers subject to chemical test- ing. CFV vs. SPV Post-Accident Positive drug tests To determine the extent chemical testing has discouraged drug use by commercial vessel personnel, Figure 1 com-pares Post-Accident veriÞ ed positives for one or more drugs between CFVs and SPVs from 2003-2011. Each year, the positivity rates of CFVs are higher than the positivity rates of SPVs by at least 32% and as much as 96%. SPV crewmem- bers averaged 77% fewer positive drug tests than CFV crew- members. Overall, the probability that Post-Accident drug test positivity rates between CFV crewmembers and SPV crew- members was due to chance is much less than Þ ve percent and thus statistically signiÞ cant. CFV vs. SPV Post-Accident alcohol tests Figure 2 compares Post-Accident alcohol test positivity rates between CFV and SPV crewmembers. Despite some ex- pected year to year variation, all of the Post-Accident alcohol test positivity rates of SPVs were lower than CFVs by at least 14% and as much as 100%. SPV crewmembers averaged 73% fewer positive alcohol tests than CFV crewmembers. Overall, the probability that Post-Accident alcohol test positivity rates between CFV crewmembers and SPV crewmembers was due to chance is less than 5 percent and thus statistically signiÞ -cant. CFVs vs. ALL vessels Post-Accident drug tests Figure 3 compares Post-Accident veriÞ ed positives for one or more drugs between CFVs and ALL vessels with crew- members subject to comprehensive chemical testing from 2003-2011. Recall from Figure 1 that Post-Accident drug test positivity rates of SPV crewmembers subject to chemical test- ing were much lower than drug test positivity rates of CFV crewmembers not otherwise subject to chemical testing. The differences were even greater when CFV crewmembersÕ posi- Regulatory USCG TESTING Why We Test for Drugs & Alcohol RBy Walter J. Brudzinski Is chemical drug and alcohol testing of commercial vessel personnel effective? 50 | Maritime Professional | 3Q 2013MP #3 50-63.indd 50MP #3 50-63.indd 509/10/2013 12:03:35 PM9/10/2013 12:03:35 PM

 49
49

 51
51
