
Page 52: of Maritime Logistics Professional Magazine (Q3 2013)
Training & Security
Read this page in Pdf, Flash or Html5 edition of Q3 2013 Maritime Logistics Professional Magazine
 51
51
 53
53
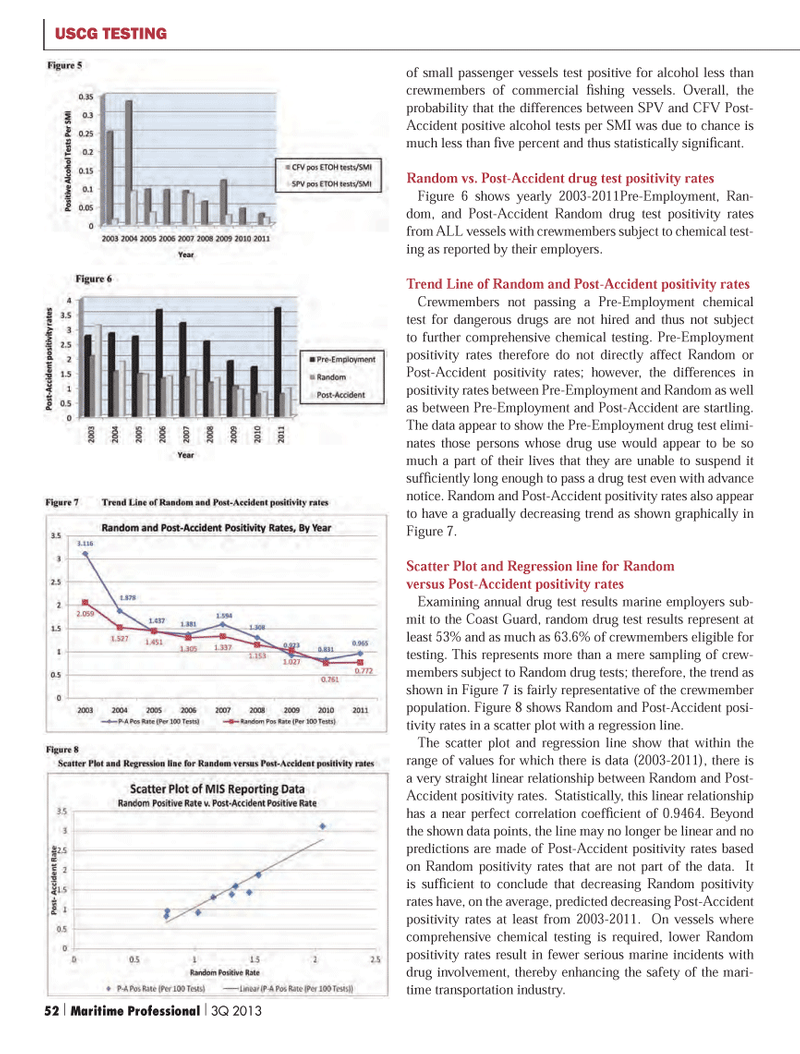
of small passenger vessels test positive for alcohol less than crewmembers of commercial Þ shing vessels. Overall, the probability that the differences between SPV and CFV Post- Accident positive alcohol tests per SMI was due to chance is much less than Þ ve percent and thus statistically signiÞ cant. Random vs. Post-Accident drug test positivity rates Figure 6 shows yearly 2003-2011Pre-Employment, Ran- dom, and Post-Accident Random drug test positivity rates from ALL vessels with crewmembers subject to chemical test- ing as reported by their employers. Trend Line of Random and Post-Accident positivity rates Crewmembers not passing a Pre-Employment chemical test for dangerous drugs are not hired and thus not subject to further comprehensive chemical testing. Pre-Employment positivity rates therefore do not directly affect Random or Post-Accident positivity rates; however, the differences in positivity rates between Pre-Employment and Random as well as between Pre-Employment and Post-Accident are startling. The data appear to show the Pre-Employment drug test elimi- nates those persons whose drug use would appear to be so much a part of their lives that they are unable to suspend it sufÞ ciently long enough to pass a drug test even with advance notice. Random and Post-Accident positivity rates also appear to have a gradually decreasing trend as shown graphically in Figure 7. Scatter Plot and Regression line for Random versus Post-Accident positivity rates Examining annual drug test results marine employers sub- mit to the Coast Guard, random drug test results represent at least 53% and as much as 63.6% of crewmembers eligible for testing. This represents more than a mere sampling of crew- members subject to Random drug tests; therefore, the trend as shown in Figure 7 is fairly representative of the crewmember population. Figure 8 shows Random and Post-Accident posi- tivity rates in a scatter plot with a regression line. The scatter plot and regression line show that within the range of values for which there is data (2003-2011), there is a very straight linear relationship between Random and Post- Accident positivity rates. Statistically, this linear relationship has a near perfect correlation coefÞ cient of 0.9464. Beyond the shown data points, the line may no longer be linear and no predictions are made of Post-Accident positivity rates based on Random positivity rates that are not part of the data. It is sufÞ cient to conclude that decreasing Random positivity rates have, on the average, predicted decreasing Post-Accident positivity rates at least from 2003-2011. On vessels where comprehensive chemical testing is required, lower Random positivity rates result in fewer serious marine incidents with drug involvement, thereby enhancing the safety of the mari- time transportation industry. USCG TESTING 52 | Maritime Professional | 3Q 2013MP #3 50-63.indd 52MP #3 50-63.indd 529/10/2013 12:04:02 PM9/10/2013 12:04:02 PM