Page 54: of Maritime Logistics Professional Magazine (Q3 2015)
Read this page in Pdf, Flash or Html5 edition of Q3 2015 Maritime Logistics Professional Magazine
stats shipyards
U.S. Shipyard Employment Data –
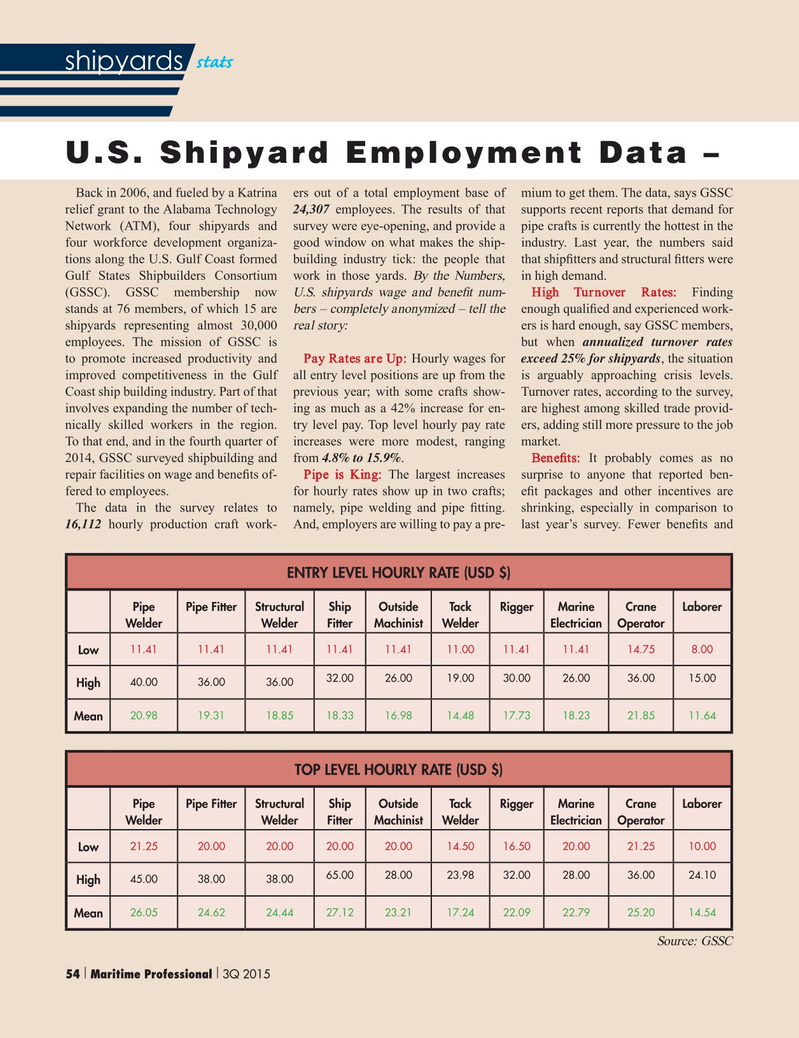
Back in 2006, and fueled by a Katrina ers out of a total employment base of mium to get them. The data, says GSSC relief grant to the Alabama Technology 24,307 employees. The results of that supports recent reports that demand for
Network (ATM), four shipyards and survey were eye-opening, and provide a pipe crafts is currently the hottest in the four workforce development organiza- good window on what makes the ship- industry. Last year, the numbers said tions along the U.S. Gulf Coast formed building industry tick: the people that that ship? tters and structural ? tters were
Gulf States Shipbuilders Consortium work in those yards. By the Numbers, in high demand.
(GSSC). GSSC membership now U.S. shipyards wage and bene? t num- High Turnover Rates: Finding stands at 76 members, of which 15 are bers – completely anonymized – tell the enough quali? ed and experienced work- shipyards representing almost 30,000 real story: ers is hard enough, say GSSC members, employees. The mission of GSSC is but when annualized turnover rates to promote increased productivity and Pay Rates are Up: Hourly wages for exceed 25% for shipyards, the situation improved competitiveness in the Gulf all entry level positions are up from the is arguably approaching crisis levels.
Coast ship building industry. Part of that previous year; with some crafts show- Turnover rates, according to the survey, involves expanding the number of tech- ing as much as a 42% increase for en- are highest among skilled trade provid- nically skilled workers in the region. try level pay. Top level hourly pay rate ers, adding still more pressure to the job
To that end, and in the fourth quarter of increases were more modest, ranging market.
2014, GSSC surveyed shipbuilding and from 4.8% to 15.9%. Bene? ts: It probably comes as no repair facilities on wage and bene? ts of- Pipe is King: The largest increases surprise to anyone that reported ben- fered to employees. for hourly rates show up in two crafts; e? t packages and other incentives are
The data in the survey relates to namely, pipe welding and pipe ? tting. shrinking, especially in comparison to 16,112 hourly production craft work- And, employers are willing to pay a pre- last year’s survey. Fewer bene? ts and
ENTRY LEVEL HOURLY RATE (USD $)
Pipe Pipe FitterStructural Ship Outside Tack RiggerMarine Crane Laborer
Welder Welder Fitter Machinist Welder Electrician Operator 11.4111.4111.4111.4111.4111.0011.4111.4114.758.00
Low 32.0026.0019.0030.0026.0036.0015.00 40.0036.0036.00
High 20.9819.3118.8518.3316.9814.4817.7318.2321.8511.64
Mean
TOP LEVEL HOURLY RATE (USD $)
Pipe Pipe FitterStructural Ship Outside Tack RiggerMarine Crane Laborer
Welder Welder Fitter Machinist Welder Electrician Operator 21.2520.0020.0020.0020.0014.5016.5020.0021.2510.00
Low 65.0028.0023.9832.0028.0036.0024.10 45.0038.0038.00
High 26.0524.6224.4427.1223.2117.2422.0922.7925.2014.54
Mean
Source: GSSC 54 Maritime Professional 3Q 2015 | | 50-63 Q3 MP2015.indd 54 9/18/2015 11:10:12 AM

 53
53

 55
55
