Page 22: of Maritime Logistics Professional Magazine (Jan/Feb 2017)
CRUISE SHIPPING PORTS
Read this page in Pdf, Flash or Html5 edition of Jan/Feb 2017 Maritime Logistics Professional Magazine
Special Report
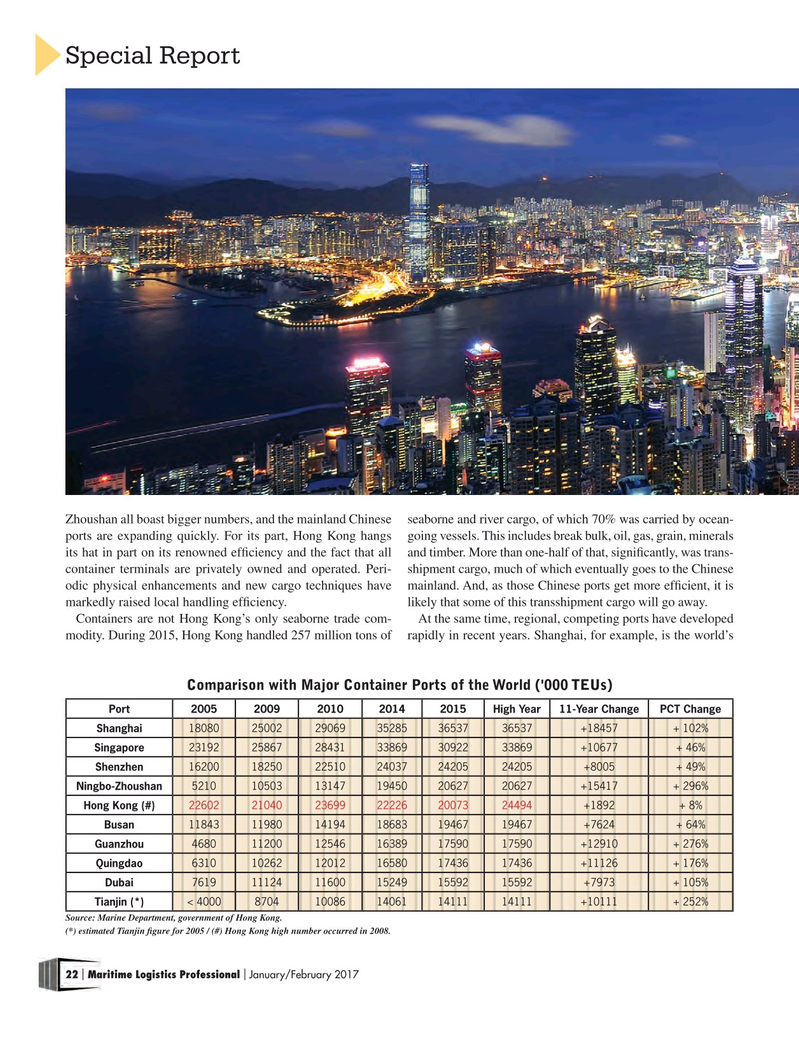
Zhoushan all boast bigger numbers, and the mainland Chinese seaborne and river cargo, of which 70% was carried by ocean- ports are expanding quickly. For its part, Hong Kong hangs going vessels. This includes break bulk, oil, gas, grain, minerals its hat in part on its renowned ef? ciency and the fact that all and timber. More than one-half of that, signi? cantly, was trans- container terminals are privately owned and operated. Peri- shipment cargo, much of which eventually goes to the Chinese odic physical enhancements and new cargo techniques have mainland. And, as those Chinese ports get more ef? cient, it is markedly raised local handling ef? ciency. likely that some of this transshipment cargo will go away.
Containers are not Hong Kong’s only seaborne trade com- At the same time, regional, competing ports have developed modity. During 2015, Hong Kong handled 257 million tons of rapidly in recent years. Shanghai, for example, is the world’s
Comparison with Major Container Ports of the World ('000 TEUs)
Port 20052009201020142015High Year11-Year ChangePCT Change
Shanghai 180802500229069352853653736537+18457 + 102%
Singapore 231922586728431338693092233869+10677 + 46%
Shenzhen 162001825022510240372420524205+8005 + 49%
Ningbo-Zhoushan 52101050313147194502062720627+15417 + 296%
Hong Kong (#) 226022104023699222262007324494 +1892 + 8%
Busan 11843 1198014194186831946719467+7624 + 64%
Guanzhou 46801120012546163891759017590+12910 + 276%
Quingdao 63101026212012165801743617436+11126 + 176%
Dubai 76191112411600152491559215592+7973 + 105%
Tianjin (*) < 4000870410086140611411114111+10111 + 252%
Source: Marine Department, government of Hong Kong.
(*) estimated Tianjin ? gure for 2005 / (#) Hong Kong high number occurred in 2008.
22 Maritime Logistics Professional January/February 2017 | |

 21
21

 23
23
