
Page 50: of Maritime Logistics Professional Magazine (May/Jun 2018)
Container Ports
Read this page in Pdf, Flash or Html5 edition of May/Jun 2018 Maritime Logistics Professional Magazine
 49
49
 51
51
STATISTICS
C & C p : ontainerships ontainer orts t’s no secret that ports have become an indicator for overall in Twenty-foot Equivalent Units (TEU) – the international market changes. That bit of wisdom comes from Descartes standard measure of containerized cargo. According to the
IDatamyne, a global trade database of up-to-date import- report, the top ports handled nearly 98% of U.S. import vol- export information. As it turns out, ‘they’re spot on.’ That’s ume in 2017.
because as shipment volumes and commodities are a critical The U.S. ports data in this report was meticulously gath- telling point for industry developments, monitoring port vol- ered from bills of lading (BoLs) that document inbound ume trends becomes a critical, if not the key variable for busi- ocean shipments and fled with U.S. Customs Automated nesses looking to gauge potential changes in demand, track Commercial Environment (ACE). TEU volumes reported are competitor activity and identify suppliers. derived from bills of lading, as released by U.S. Customs,
In its recently issued 2018 U.S. Ports Report, Descartes excluding empty containers and shipments with freight re-
Datamyne offers an in-depth annual look of the top 20 U.S. maining on board (FROB). The value of imports is as re- ocean ports by import volume. That volume is measured ported by U.S. Census.
Separately, The Alphaliner TOP 100 provides a constantly updated ranking of the 100 largest container/liner operators as
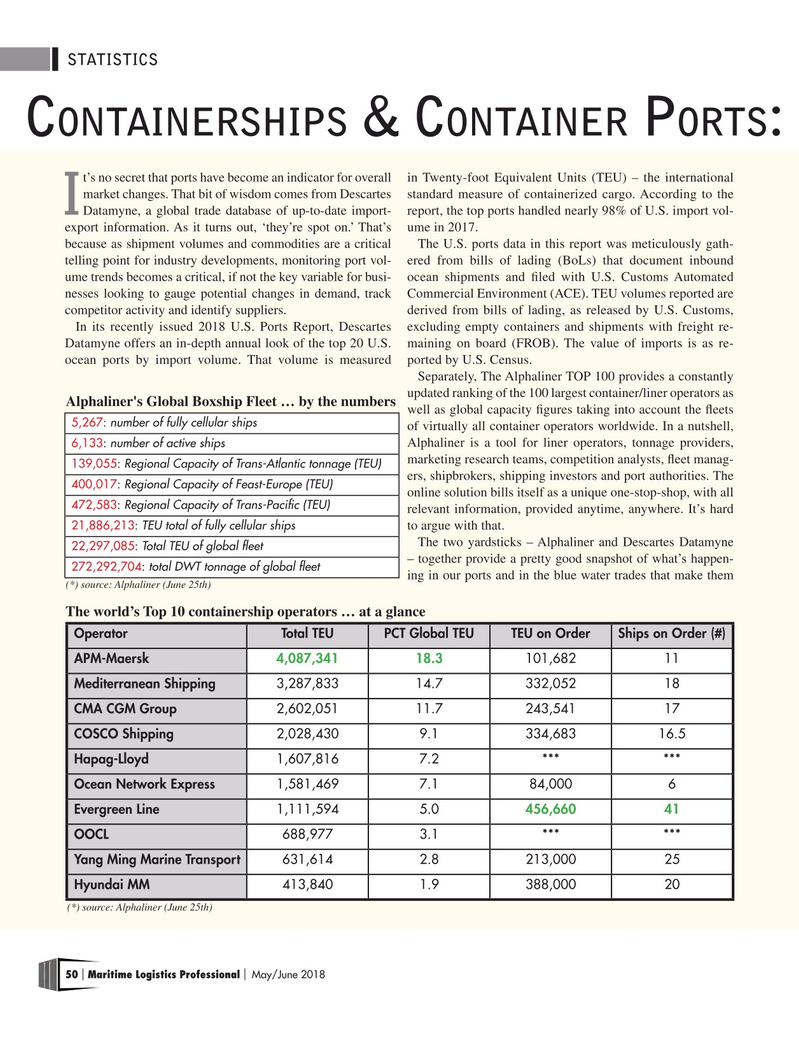
Alphaliner's Global Boxship Fleet … by the numbers well as global capacity fgures taking into account the feets 5,267: number of fully cellular ships of virtually all container operators worldwide. In a nutshell,
Alphaliner is a tool for liner operators, tonnage providers, 6,133: number of active ships marketing research teams, competition analysts, feet manag- 139,055: Regional Capacity of Trans-Atlantic tonnage (TEU) ers, shipbrokers, shipping investors and port authorities. The 400,017: Regional Capacity of Feast-Europe (TEU) online solution bills itself as a unique one-stop-shop, with all 472,583: Regional Capacity of Trans-Pacifc (TEU) relevant information, provided anytime, anywhere. It’s hard 21,886,213: TEU total of fully cellular ships to argue with that.
The two yardsticks – Alphaliner and Descartes Datamyne 22,297,085: Total TEU of global feet – together provide a pretty good snapshot of what’s happen- 272,292,704: total DWT tonnage of global feet ing in our ports and in the blue water trades that make them (*) source: Alphaliner (June 25th)
The world’s Top 10 containership operators … at a glance
Operator Total TEU PCT Global TEU TEU on Order Ships on Order (#)
APM-Maersk 4,087,341 18.3 101,682 11
Mediterranean Shipping 3,287,833 14.7 332,052 18
CMA CGM Group 2,602,051 11.7 243,541 17
COSCO Shipping 2,028,430 9.1 334,683 16.5
Hapag-Lloyd 1,607,816 7.2 *** ***
Ocean Network Express 1,581,469 7.1 84,000 6
Evergreen Line 1,111,594 5.0 456,660 41
OOCL 688,977 3.1 *** ***
Yang Ming Marine Transport 631,614 2.8 213,000 25
Hyundai MM 413,840 1.9 388,000 20 (*) source: Alphaliner (June 25th) 50 Maritime Logistics Professional May/June 2018 | |