
Page 52: of Maritime Logistics Professional Magazine (May/Jun 2018)
Container Ports
Read this page in Pdf, Flash or Html5 edition of May/Jun 2018 Maritime Logistics Professional Magazine
 51
51
 53
53
STATISTICS trade policy and recent tariffs are areas that will no doubt have tool contains key fnancial information for Fitch-rated stand- an impact on select U.S. ports in the coming months. In fact, alone port issuers in the U.S., graphical plotting function for commodity exposure and tariff concerns were in part why annual and median performance and a radar chart that indi-
Fitch kept its Rating Outlook for the Port of Alabama at Nega- cates key risk levels. The tool allows selection of medians by tive following its last rating review. rating category as well as by market size. The database now
Fitch has also launched its 2018 update to the interactive includes six years of data, providing a more comprehensive peer study for standalone U.S. port credits, the Fitch Analyti- base for historical trend analysis.
cal Comparative Tool, or FACT concurrently with release of The international containership sector, the liner alliances today’s peer review. FACT uses an interactive interface to that have recently emerged and reshuffed, together with the easily review and compare key credit metrics that underpin ports they serve, all combine to provide reliable economic in-
Fitch’s analysis of U.S. ports, allowing users to select subsets dicators. These barometers will no doubt become even more of Fitch’s rated ports for comparison. The interactive FACT important in the potentially turbulent months ahead.
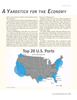
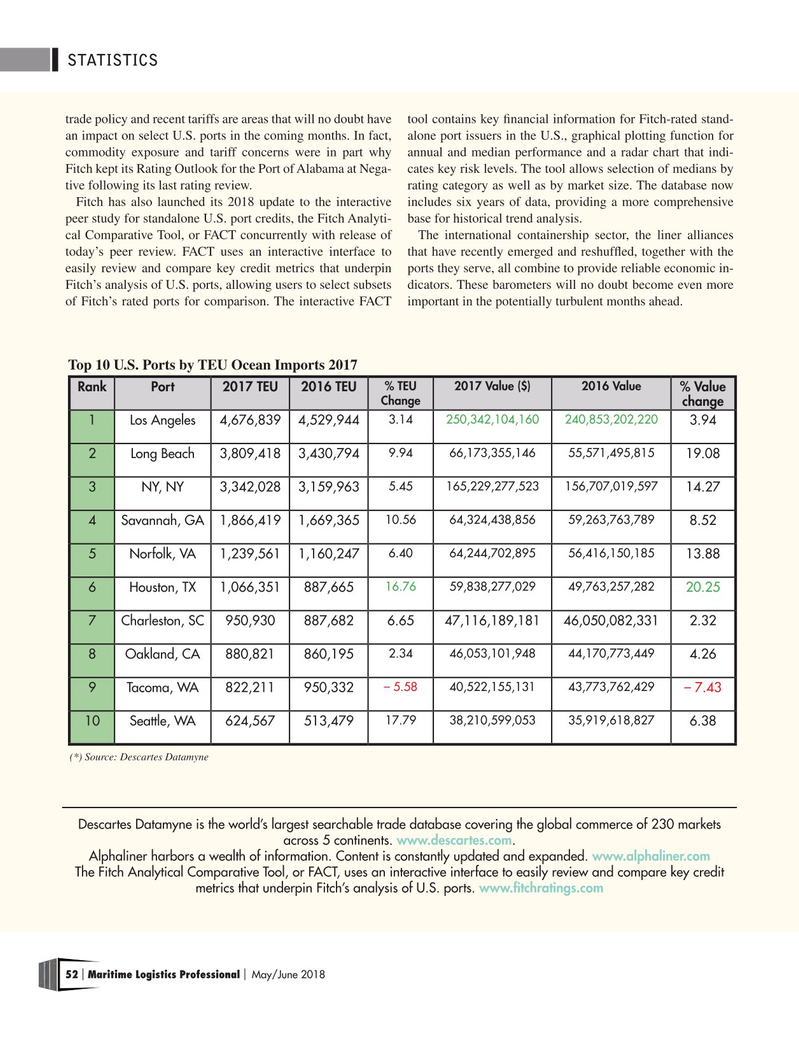
Top 10 U.S. Ports by TEU Ocean Imports 2017 % TEU 2017 Value ($) 2016 Value
Rank Port 2017 TEU 2016 TEU % Value
Change change 3.14 250,342,104,160 240,853,202,220 1 Los Angeles 4,676,839 4,529,944 3.94 9.94 66,173,355,146 55,571,495,815 2 Long Beach 3,809,418 3,430,794 19.08 5.45 165,229,277,523 156,707,019,597 3 NY, NY 3,342,028 3,159,963 14.27 10.56 64,324,438,856 59,263,763,789 4 Savannah, GA 1,866,419 1,669,365 8.52 6.40 64,244,702,895 56,416,150,185 5 Norfolk, VA 1,239,561 1,160,247 13.88 16.76 59,838,277,029 49,763,257,282 6 Houston, TX 1,066,351 887,665 20.25 7 Charleston, SC 950,930 887,682 6.65 47,116,189,181 46,050,082,331 2.32 2.34 46,053,101,948 44,170,773,449 8 Oakland, CA 880,821 860,195 4.26 – 5.58 40,522,155,131 43,773,762,429 9 Tacoma, WA 822,211 950,332 – 7.43 17.79 38,210,599,053 35,919,618,827 10 Seattle, WA 624,567 513,479 6.38 (*) Source: Descartes Datamyne
Descartes Datamyne is the world’s largest searchable trade database covering the global commerce of 230 markets across 5 continents. www.descartes.com.
Alphaliner harbors a wealth of information. Content is constantly updated and expanded. www.alphaliner.com
The Fitch Analytical Comparative Tool, or FACT, uses an interactive interface to easily review and compare key credit metrics that underpin Fitch’s analysis of U.S. ports. www.ftchratings.com 52 Maritime Logistics Professional May/June 2018 | |