
Page 48: of Maritime Logistics Professional Magazine (Nov/Dec 2019)
Short Sea Shipping Ports
Read this page in Pdf, Flash or Html5 edition of Nov/Dec 2019 Maritime Logistics Professional Magazine
 47
47
 49
49
INSIGHTS
Container Volume Data
By John D. McCown
The China Effect he monthly volume data on container movements includes a wealth of information at both the macro and micro level. Recently the monthly container volume data in the U.S. has
T When aggregated, it has historically provided a timely and been affected by the China trade situation. My focus is on inbound useful pulse of overall economic activity. Warren Buffet has said loaded container volume as that is the headhaul direction for all that if he was stuck on a desert island and allowed only one num- large U.S. ports. It is twice the outbound volume and typically ber to see how the economy was doing, it would be monthly rail- involves higher value loads. In addition to the inbound lane being car loadings. Monthly container activity is a similar benchmark, more relevant, it is more connected with China. Some 65% of U.S. albeit with more of an international focus. Subsets of regional or inbound loaded containers originate in the Far East and two-thirds even individual port data, particularly when reviewed over time, of those come from China. That translates into approximately 43% can point to geographical differences in economic activity. of the inbound containers into the U.S. originating in China.
At the most micro level, container volume data telegraphs the Seven of the ten largest container ports in the world are now later detailed census trade data where shipment trends by com- in China. There are nine container ports in China that are larger modity codes give a precise pulse on individual products by state. than Los Angeles, our largest port. Just the average volume at
The monthly container volume data comes out as early as fve days those nine China ports is more than twice Los Angeles’s total after month-end and is available from all the largest U.S. ports by container volume. The two-way trade between Asia and North mid-month. That works out to three weeks earlier than the detailed America is 15.8% of container volume worldwide and 24.6% of census data released fve weeks after each month-end. loaded container-miles. This large lane is dominated by moves
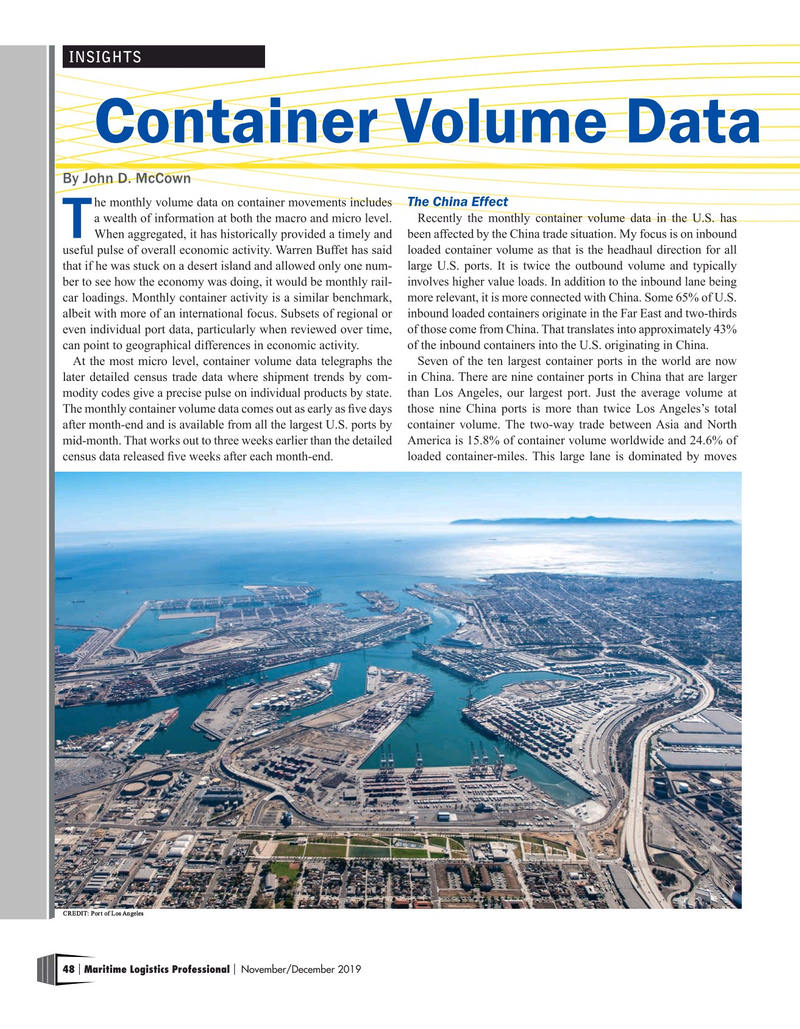
CREDIT: Port of Los Angeles 48 Maritime Logistics Professional November/December 2019 | |