
Page 33: of Maritime Reporter Magazine (June 1985)
Read this page in Pdf, Flash or Html5 edition of June 1985 Maritime Reporter Magazine
 32
32
 34
34
WORLD SHIPBUILDING
The world fleet has continued to decrease, although new deliveries are keeping almost abreast of scrap- pings and casualties. It is interesting to note that the fleet increased by 100 million gross tons every five years from 1969 to 1979, but is now only 5.5 million gross tons higher than it was in 1979.
In the past year, the tonnage laid up has shown a continued decrease (continued on page 34)
Table 1—Annual Orders and Completions (In million gross tonnage)
Year Orders Placed Completions 1974 28.37 33.54 1975 13.79 34.20 1976 12.94 33.92 1977 11.09 27.53 1978 8.03 18.19 1979 16.84 14.29 1980 18.97 13.10 1981 17.23 16.93 1982 11.23 16.82 1983 19.48 15.91 1984 (est.) 16.00 18.00
Table 2—Percentage of
New Orders Placed
South Rest of
Year Japan Korea EEC Comecon World 1974 38.42% 2.82% 26.99% 2.87% 28.90% 1975 49.25 3.72 13.44 8.37 25.22 1976 56.01 2.47 10.56 10.00 20.96 1977 52.13 5.67 13.11 7.96 21.13 1978 43.25 3.71 14.89 11.49 26.66 1979 49.47 6.20 14.02 6.82 23.49 1980 52.66 8.96 12.11 4.22 22.05 1981 48.00 8.08 14.04* 6.06 23.82 1982 49.75 9.57 13.47* 9.44 17.77 1983 56.56 19.21 7.40* 5.14 11.69 1984 (est.) 55.92 17.40 9.99* 2.46 14.23 * Including Greece
Table 4—Percentage of Orders Placed in Principal Shipbuilding Countries
Country of Build 1979 1980 1981 1982 1983 1984
Japan 49.5% 52.7% 48.0% 49.7% 56.6% 55.9%
South Korea 6.2 9.0 8.1 9.6 19.2 17.4
People's Republic of China (inc. Taiwan) 2.6 3.7 5.4 2.6 2.8 5.3
Federal Republic of Germany 4.4 2.2 4.4 4.4 2.4 3.1
Denmark 2.3 2.1 2.5 1.3 2.4 2.9
Brazil 2.7 0.3 3.3 2.7 1.7 2.3
Finland 1.6 1.5 1.8 1.0 0.4 2.0
United States 2.8 3.4 1.3 1.0 1.1 1.7
German Democratic Republic 0.9 1.2 1.9 4.0 2.4 1.0
Netherlands 0.7 1.2 1.2 1.2 0.6 1.0
United Kingdom 1.4 2.7 2.9 2.5 0.6 1.0
France 1.5 1.7 1.9 0.9 0.7 0.9
Poland 4.6 1.0 0.9 1.7 2.1 0.9
Norway 2.1 1.7 1.4 0.8 0.3 0.8
Belgium 2.7 0.6 0.4 0.5 0.5 0.7
Yugoslavia 2.8 1.7 0.7 2.4 1.2 0.6
Bulgaria 1.1 0.8 1.1 1.1 0.6 0.5
Rest of the World 10.1 12.5 12.8 12.6 4.4 2.0
Gross tonnage 16,843,354 17,230,094 19,480,030 18,969,044 11,231,759 16,000,000 (estimated)
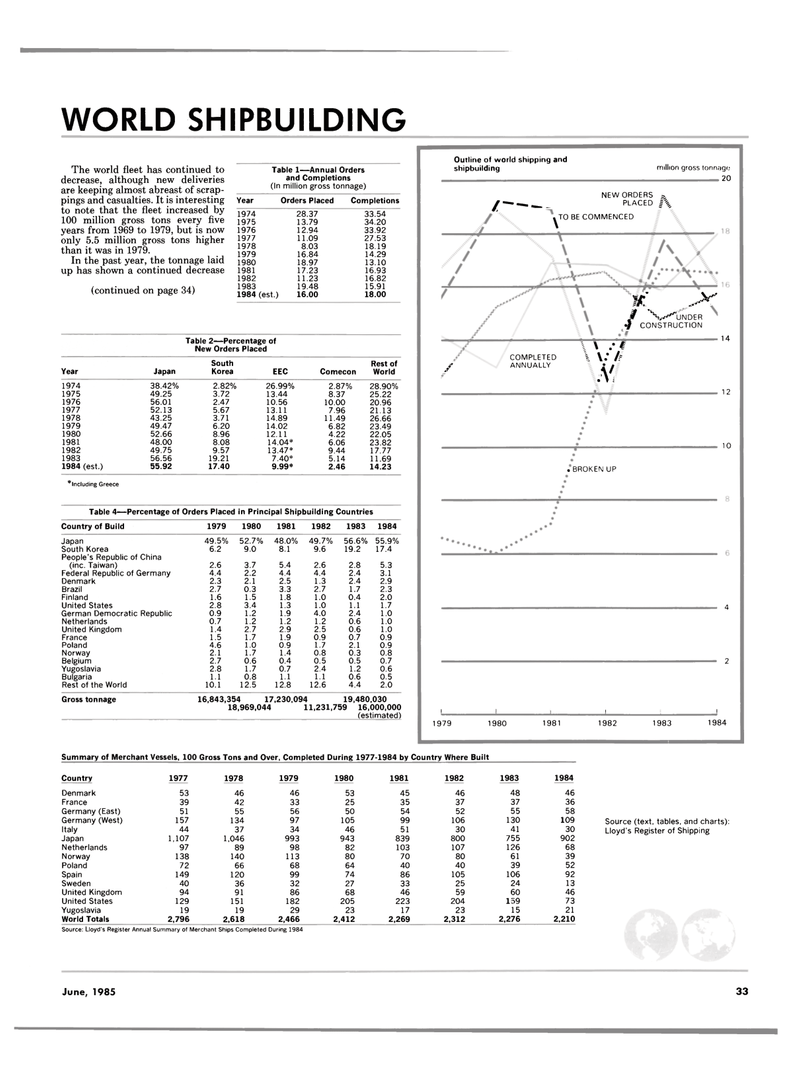
Outline of world shipping and shipbuilding million gross tonnage 20
NEW ORDERS 2. / — _ PLACED §\ yTO BE COMMENCED rrrr
COMPLETED /=
ANNUALLY y >" / UNDER 4 CONSTRUCTION 14 / .V 1 2 10 .BROKEN UP 4 2
I I I ' • i 1979 1980 1981 1982 1983 1984
Summary of Merchant Vessels, 100 Gross Tons and Over, Completed During 1977-1984 by Country Where Built
Country 1977 1978 1979 1980 1981 1982 1983 1984
Denmark 53 46 46 53 45 46 48 46
France 39 42 33 25 35 37 37 36
Germany (East) 51 55 56 50 54 52 55 58
Germany (West) 157 134 97 105 99 106 130 109
Italy 44 37 34 46 51 30 41 30
Japan 1,107 1,046 993 943 839 800 755 902
Netherlands 97 89 98 82 103 107 126 68
Norway 138 140 113 80 70 80 61 39
Poland 72 66 68 64 40 40 39 52
Spain 149 120 99 74 86 105 106 92
Sweden 40 36 32 27 33 25 24 13
United Kingdom 94 91 86 68 46 59 60 46
United States 129 151 182 205 223 204 159 73
Yugoslavia 19 19 29 23 17 23 15 21
World Totals 2,796 2,618 2,466 2,412 2,269 2,312 2,276 2,210
Source: Lloyd's Register Annual Summary of Merchant Ships Completed During 1984
Source (text, tables, and charts):
Lloyd's Register of Shipping
June, 1985 33
