Page 19: of Maritime Reporter Magazine (August 1986)
Read this page in Pdf, Flash or Html5 edition of August 1986 Maritime Reporter Magazine
 18
18
 20
20
covery, user fee schemes related to a range of federal activities and ser- vices all of critical importance to the flow of waterborne commerce.
Agencies involved include the CoTps of Engineers, the Customs Service, the Coast Guard, and the Immigra- tion Naturalization Service. Per- haps most troublesome regarding these user fee schemes is the fact that each user fee scheme has been proposed independently, without an understanding or a recognition of the cumulative impact of all such cost-recovery schemes on the essen- tial flow of U.S. waterborne com- merce.
For the past six years, perhaps the most difficult issue for U.S. public port management has been the Rea- gan Administration's insistence that the traditional federal role in spon- soring most costs involved in new navigation channel construction and channel maintenance must be significantly reduced. After consid- erable negotiation and debate, the
U.S. public port industry has gener- ally accepted the idea that, in return for new channel projects, an in- creased local nonfederal share of the total project costs will be required.
It should be noted that there has not been an omnibus water projects bill since 1970—nearly 16 years!
Moreover, the public port industry has acknowledged the inevitability of a system of user fees established to recover a portion of the Corps maintenance costs. This radical new port development legislation may be enacted by the time this article is published. Clearly, one potential ad- vantage of increased local cost-shar- ing for federal navigation channel projects is the prospect of greatly speeding up the process by which those projects are approved, funded, and constructed which now takes, on average, more than 25 years.
In spite of these increased cost burdens proposed to be placed on
U.S. public port authorities at the federal level, the Reagan Adminis- tration and certain members of
Congress had proposed, within the rationale of "tax-reform", legisla- tion that would have virtually elimi- nated the ability of public port au- thorities to use tax-exempt bonds to finance port facility development.
Wisely, both houses of Congress have recognized the fundamental importance of continuing the tax- exempt bond financing capabilities of public ports in tax-reform legisla- tion that is (as of this writing) now in Senate/House Conference Com- mittee. Certain restrictions still need to be resolved, but the basic public purpose of public port au- thorities to develop facilities needed to serve the essential flow of U.S. waterborne commerce has again been confirmed by the U.S. Con- gress.
In short, the outlook for the U.S. public port industry is positive. U.S. public port authorities continue to demonstrate their ability to fulfill their critical responsibilities in pro- moting the interests of their local communities, their region, and the nation. •
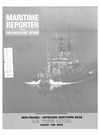
U.S. Oceanborne Foreign Trade
Top Thirty U.S. Ports
Liner Service
Calendar Year 1984
Thousands Of Long Tons
Total Pct(l) Import Pct(l) Export Pct(l)
RANK U.S. PORT Tons Change Tons Change Tons Change 1 New York 10283 7 7789 15 2494 -14 2 Long Beach 5726 14 3378 22 2348 5 3 Seattle 4667 18 2254 28 2413 9 4 Houston 4388 17 1574 38 2814 8 5 Los Angeles 4373 15 2498 15 1875 15 6 New Orleans 4276 2 1840 19 2436 -7 7 Baltimore 3961 17 2447 53 1514 -15 8 Oakland 3893 23 1569 43 2324 13 9 Savannah 2626 24 1185 42 1441 12 10 Charleston 2434 11 960 21 1474 5 11 Norfolk 1730 9 952 19 778 -1 12 Portland, Oregon 1289 34 316 53 973 29 13 Miami 1235 12 659 31 576 -4 14 Philadelphia 1199 4 922 7 277 -6 15 Galveston 829 -27 226 -36 603 -23 16 Tacoma 705 28 487 23 218 39 17 San Juan, P.R. 668 10 356 20 312 + * 18 Jacksonville 640 6 270 2 370 9 19 San Francisco 588 2 288 8 300 -3 20 Wilmington, N.C. 567 7 203 22 364 1 21 Longview 469 -10 3 -91 466 -5 22 Mobile 424 -3 144 11 280 -9 23 Port Everglades 404 22 336 23 68 19 24 Corpus Christi 396 196 18 -18 378 238 25 Baton Rouge 356 29 130 76 226 12 26 Boston 299 -22 230 -20 69 -27 27 Coos Bay 272 4 1 -67 271 5 28 Wilmington, Del. 216 41 209 43 7 7 29 Newport News 211 -7 130 17 81 -30 30 Richmond, Va. 189 25 62 29 127 23
All Other Ports 4199 8 1456 33 2743 -2
Total 63512 12 32892 23 30620 2 *-Less than 0.5 percent. (l)-Compared to Calendar Year 1983.
Source: Maritime Administration, Office of Port and Intermodal Development f Kfl l^l^l ipvi
Seas Calling. High Seas Ca) 1 i ng lets you conduct business at the helm when your associates or clients are on shore. It works shore to ship too. And a High
Seas phone call can average just $4.98 per minute* for a 10- minutecall.
High Seas Calling is very easy to use. It's reliable, using
AT&T Operators to service your calls. And it gives you fine quality transmission. So dial 1 800 SEA CALL for further details or for our free brochure. Our toll-free number puts you in touch with ways to keep in touch. 'Federal excise lax of 3% may apply.
AT&T
The right choice.
August, 1986
Circle 222 on Reader Service Card 21
