Page 42: of Maritime Reporter Magazine (June 1989)
Read this page in Pdf, Flash or Html5 edition of June 1989 Maritime Reporter Magazine
WORLD SHIPBUILDING
New Orders Up For Second Year In A Row
According to Drewry Shipping
Consultants Ltd., London, England, an aging world fleet (27 percent of the fleet is more than 15 years old), should provide the world's ship- building industries with a modest increase in work based primarily on replacement tonnage. The major market for builders in the early/ middle 1990s will be, according to
Drewry, the construction of tankers and, in particular, VLCC tonnage.
Tonnage of this size is still the most economic way to move crude oil, and vessels in the 250,000-280,000-dwt range will increasingly be in demand as 1970s-built tonnage is scrapped.
Drewry predicts aggregate new- building demand in the period up to 1997 will be 330 million dwt (200 million grt), with tankers account- ing for nearly 40 percent of total output. Of this figure, VLCC de- mand is estimated to be over 70 mil- lion dwt, i.e. nearly 300 vessels.
This optimistic view seems to be backed by a recent report entitled "Outlook for the World Shipping
Market 1988-2000," published by the City University Business School of London. The report predicts that shipbuilding output in deadweight tons will nearly double in the next five years. The forecast is based on continued world demand for bulk freight, higher average dry cargo time charter rates, and scrapping of more tankers and dry cargo vessels as they become older and world metal prices rise. The report points out that by 1993, more than 55 per- cent of the tanker fleet will be at
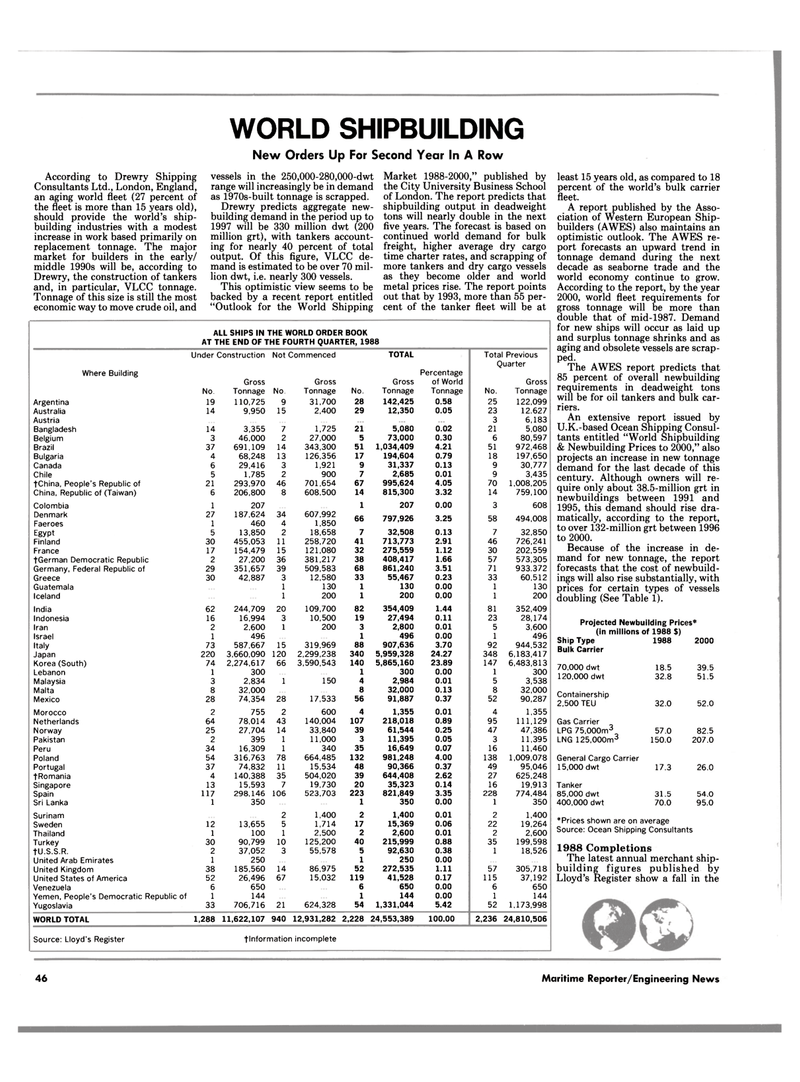
ALL SHIPS IN THE WORLD ORDER BOOK
AT THE END OF THE FOURTH QUARTER, 1988
Where Building
Under Construction Not Commenced TOTAL
Percentage
Gross Gross Gross of World Gross
No. Tonnage No. Tonnage No. Tonnage Tonnage No. Tonnage
Argentina 19 110,725 9 31,700 28 142,425 0.58 25 122,099
Australia 14 9,950 15 2,400 29 12,350 0.05 23 12.627
Austria 3 6,183
Bangladesh 14 3,355 7 1,725 21 5,080 0.02 21 5,080
Belgium 3 46.000 2 27,000 5 73,000 0.30 6 80,597
Brazil 37 691,109 14 343,300 51 1,034,409 4.21 51 972,468
Bulgaria 4 68,248 13 126,356 17 194,604 0.79 18 197,650
Canada 6 29,416 3 1,921 9 31,337 0.13 9 30,777
Chile 5 1,785 2 900 7 2,685 0.01 9 3,435 tChina, People's Republic of 21 293,970 46 701,654 67 995,624 4.05 70 1,008,205
China, Republic of (Taiwan) 6 206,800 8 608,500 14 815,300 3.32 14 759,100
Colombia 1 207 1 207 0.00 3 608
Denmark 27 187,624 34 607,992 66 797,926 3.25 58 494,008
Faeroes 1 460 4 1,850
Egypt 5 13,850 2 18,658 7 32,508 0.13 7 32,850
Finland 30 455,053 11 258,720 41 713,773 2.91 46 726,241
France 17 154,479 15 121,080 32 275,559 1.12 30 202,559 tGerman Democratic Republic 2 27,200 36 381,217 38 408,417 1.66 57 573,305
Germany, Federal Republic of 29 351,657 39 509,583 68 861,240 3.51 71 933.372
Greece 30 42,887 3 12,580 33 55,467 0.23 33 60,512
Guatemala 1 130 1 130 0.00 1 130
Iceland 1 200 1 200 0.00 1 200
India 62 244,709 20 109,700 82 354,409 1.44 81 352,409
Indonesia 16 16,994 3 10,500 19 27,494 0.11 23 28,174
Iran 2 2,600 1 200 3 2,800 0.01 5 3,600
Israel 1 496 1 496 0.00 1 496
Italy 73 587,667 15 319,969 88 907,636 3.70 92 944,532
Japan 220 3,660,090 120 2,299.238 340 5,959,328 24.27 348 6,183,417
Korea (South) 74 2,274,617 66 3,590,543 140 5,865,160 23.89 147 6,483,813
Lebanon 1 300 1 300 0.00 1 300
Malaysia 3 2,834 1 150 4 2,984 0.01 5 3,538
Malta 8 32,000 8 32,000 0.13 8 32,000
Mexico 28 74,354 28 17,533 56 91,887 0.37 52 90,287
Morocco 2 755 2 600 4 1,355 0.01 4 1,355
Netherlands 64 78,014 43 140,004 107 218,018 0.89 95 111,129
Norway 25 27,704 14 33,840 39 61,544 0.25 47 47,386
Pakistan 2 395 1 11,000 3 11,395 0.05 3 11,395
Peru 34 16,309 1 340 35 16,649 0.07 16 11,460
Poland 54 316,763 78 664,485 132 981,248 4.00 138 1,009,078
Portugal 37 74,832 11 15,534 48 90,366 0.37 49 95,046 tRomania 4 140,388 35 504,020 39 644,408 2.62 27 625,248
Singapore 13 15,593 7 19,730 20 35,323 0.14 16 19,913
Spain 117 298,146 106 523.703 223 821,849 3.35 228 774,484
Sri Lanka 1 350 1 350 0.00 1 350
Surinam 2 1,400 2 1,400 0.01 2 1,400
Sweden 12 13,655 5 1,714 17 15,369 0.06 22 19,264
Thailand 1 100 1 2,500 2 2,600 0.01 2 2,600
Turkey 30 90,799 10 125,200 40 215,999 0.88 35 199,598 tU.S.S.R. 2 37,052 3 55,578 5 92,630 0.38 1 18,526
United Arab Emirates 1 250 1 250 0.00
United Kingdom 38 185,560 14 86,975 52 272,535 1.11 57 305,718
United States of America 52 26,496 67 15,032 119 41,528 0.17 115 37,192
Venezuela 6 650 6 650 0.00 6 650
Yemen, People's Democratic Republic of 1 144 1 144 0.00 1 144
Yugoslavia 33 706,716 21 624,328 54 1,331,044 5.42 52 1,173,998
WORLD TOTAL 1,288 11,622,107 940 12,931,282 2,228 24,553,389 100.00 2,236 24,810,506
Total Previous
Quarter
Source: Lloyd's Register tlnformation incomplete least 15 years old, as compared to 18 percent of the world's bulk carrier fleet.
A report published by the Asso- ciation of Western European Ship- builders (AWES) also maintains an optimistic outlook. The AWES re- port forecasts an upward trend in tonnage demand during the next decade as seaborne trade and the world economy continue to grow.
According to the report, by the year 2000, world fleet requirements for gross tonnage will be more than double that of mid-1987. Demand for new ships will occur as laid up and surplus tonnage shrinks and as aging and obsolete vessels are scrap- ped.
The AWES report predicts that 85 percent of overall newbuilding requirements in deadweight tons will be for oil tankers and bulk car- riers.
An extensive report issued by
U.K.-based Ocean Shipping Consul- tants entitled "World Shipbuilding & Newbuilding Prices to 2000," also projects an increase in new tonnage demand for the last decade of this century. Although owners will re- quire only about 38.5-million grt in newbuildings between 1991 and 1995, this demand should rise dra- matically, according to the report, to over 132-million grt between 1996 to 2000.
Because of the increase in de- mand for new tonnage, the report forecasts that the cost of newbuild- ings will also rise substantially, with prices for certain types of vessels doubling (See Table 1).
Projected Newbuilding Prices* (in millions of 1988 $)
Ship Type 1988
Bulk Carrier 70,000 dwt 18.5 120,000 dwt 32.8
Containership 2,500 TEU 32.0
Gas Carrier
LPG 75,000m3 57.0
LNG 125,000m3 150.0
General Cargo Carrier 15,000 dwt 17.3
Tanker 85,000 dwt 31.5 400,000 dwt 70.0 'Prices shown are on average
Source: Ocean Shipping Consultants 1988 Completions
The latest annual merchant ship- building figures published by
Lloyd's Register show a fall in the 2000 39.5 51.5 52.0 82.5 207.0 26.0 54.0 95.0 46 Maritime Reporter/Engineering News

 41
41

 43
43
