Page 53: of Maritime Reporter Magazine (March 1992)
Read this page in Pdf, Flash or Html5 edition of March 1992 Maritime Reporter Magazine
 52
52
 54
54
Coast Guard Improves Inspection Program To Detect Unsafe Tankers
More Oil Is Shipped In U.S. Waters Than Any Other Commodity; Petroleum And Petroleum
Products Account For 40 Percent Of The Cargo Shipped Through U.S. Waters
Coast Guard inspections have not always been reliable in detecting unsafe tankers. For tankers regis- tered in the United States, such prob- lems as too few inspectors, inexperi- enced inspectors, and limited inspec- tion procedures have hampered the
Coast Guard's inspection efforts.
Tankers are an important means of transporting petroleum and petro- leum products and they are also a significant source of oil pollution.
The prevention of accidents or mis- haps that can cause oil spills is a principal reason that the Coast
Guard periodically inspects the con- dition of tankers. According to Coast
Guard officials, a number of factors can contribute to unsafe vessel con- ditions including the following: • Increased age: The world tanker fleet has aged dramatically.
Generally, according to Coast Guard officials, the older a tanker is, the more likely it is to develop signifi-
Guard officials state, as a cost-sav- ing measure, vessels over the last 20 years often were built with high- tensile steel. This steel, also called high-strength steel, saves money because less of it is needed in con- struction, and the vessel's resulting lighter weight allows more cargo to be carried. However, a 1990 Coast
Guard study on structural failures found that vessels built with high- tensile steel are more likely to de- velop cracks in their hulls or sup- porting beams. • Bad weather: According to
Coast Guard officials, severe weather conditions, such as those encountered by TAPS vessels in the
Gulf of Alaska, can put stress on the hull and supporting structures and cause cracks to develop.
More oil is shipped in U.S. waters than any other commodity. Accord- ing to the U.S. Army Corps of Engi- neers' Waterborne Commerce of the
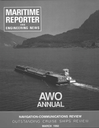
Figure 1.1
Amount of Petroleum Transported by Water in
U.S. Domestic and International Trade
Millions of Tons of Petroleum Transported 1000
Source: GAO Analysis of U.S. Army Corps of Engineers Data. cant problems, such as deteriora- tion of structural supports or break- downs of key machinery or equip- ment. While age alone was not typi- cally viewed by participants at the 1991 International Marine Safety
Workshop as an important factor in vessels' not meeting international standards, it can play a crucial role when coupled with poor mainte- nance. • Lower maintenance levels:
Problems that can develop from ves- sel aging can often be prevented by good maintenance, according to
Coast Guard officials. However, these officials stated that mainte- nance has decreased in recent years, in part because of depressed finan- cial conditions in the shipping in- dustry. Maintaining tankers can be expensive. For example, an oil in- dustry representative told us that shipyard maintenance on large oil tankers over 10 years old typically costs between $3 million and $6 mil- lion during the 2-year drydocking cycle. • Use of high-tensile steel: Coast
United States, petroleum and petro- leum products accounted for more than 40 percent of the cargo shipped to, from, or through the United
States by water in 1988, more than twice as much as the next most com- mon cargo. As figure 1.1 shows, the amount of oil shipped by water in 1988 is roughly the same as was shipped in 1976—nearly 860 mil- lion tons.
Tanker Casualty and
Pollution Rates
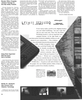
Figure 1.2 shows the number of
U.S. tanker casualties reported be- tween 1980 and 1988. In addition, a 1990 study by the National Research
Council on crew size and maritime safety found that rates of maritime accidents and personnel injuries, worldwide and in the U.S. fleet, have declined steadily over the last 20 years. For example, data show that accident rates for large tankers (those over 6,000 gross tons) have declined to about 2 per 100 vessels, a level roughly 20 percent below those of the mid- to late 1970s.
In addition to reports of ship casu- alties, the Coast Guard receives re- ports of pollution in U.S. waters.
Although the number of reported spills from tankers has declined since the mid-1970s, the amount of oil spilled each year varies greatly.
In the first 9 months of 1990, the
Coast Guard was notified of 303 pollution incidents in which tank- ers released about 1.8 million gal- lons of oil and hazardous substances, nearly 24 percent of the oil and haz- ardous substances discharged into
U.S. waters and reported to the
Coast Guard that year.
Age of Tanker Fleet
The proportion of older tankers in the world fleet is growing. From 1981 to 1990, the percentage of the world fleet (measured in tonnage) that was at least 15 years old has increased from about 15 percent to nearly 45 percent. The same trend is evident when the number of aging tankers is expressed as a percent- age of the number of tankers. The percentage of the world tanker fleet that is 15 or more years old has increased significantly since 1970, when about 30 percent of the world's tankers were 15 years old or older.
By 1990, the percentage of tankers at least 15 years old had increased to nearly 50 percent.
Compared with the world tanker fleet, the U.S. tanker fleet includes a greater percentage of tankers that
Figure 1.2
U.S. Tanker Accidents
Number of Reported Accidents 320 are more than 15 years old. Accord- ing to the Coast Guard, in 1990, more than 62 percent of U.S. tank- ers were at least 16 years old, while nearly one-third (32 percent) were 30 or more years old. Figure 1.3
Figure 1.3
U.S. Tankers, by Age, 1990 6-10 Years (41 Ships) 26-30 Years (16 Ships) 0-5 Years (10 Ships) 21-25 Years (28 Ships) 16-20 Years (50 Ships)
Source: U.S. Coast Guard.
Source: U.S. Coast Guard. shows the ages of U.S. tankers in 1990. Meanwhile, about 48 percent of the world tanker fleet was at least 15 years old in 1990, and only about 8 percent was at least 30 years old.
Figure 1.4 shows the age of the world tanker fleet in 1990.
Since the 1950s, the percentage of the world's tanker fleet operating under the U.S. flag has declined significantly. In 1955, more than 14 percent of the world's tankers were registered in the U.S. By 1990, about 4 percent of the world's tankers were registered in the U.S. In addition, many of the tankers serving the
United States are registered in other countries. In 1990, for example, for- eign tankers visited U.S. ports nearly twice as often as U.S. tankers.
The Coast Guard has taken and plans to take many actions to strengthen its tanker inspection procedures. For example, it began requiring operators of U.S. TAPS tankers in 1990 and of foreign TAPS tankers in 1991 to prepare inspec- tion plans for areas on their tankers susceptible to cracking. The plans are to lay out a strategy for monitor- ing these areas and tracking the effectiveness of repairs.
Changes to increase the flexibil- ity of inspections are also under con- sideration in an initiative called the
Merchant Vessel Incentive Inspec- tion Program.
Figure 1.4
World Tankers, by Age, 1990 20-24 Years (817 Ships) 25-29 Years (463 Ships) 29+ Years (547 Ships) 0-4 Years (777 Ships) 5-9 Years (1136 Ships)
Source: Lloyd's Register Statistical Table.
March, 1992 101
