
Page 83: of Maritime Reporter Magazine (June 2003)
Read this page in Pdf, Flash or Html5 edition of June 2003 Maritime Reporter Magazine
 82
82
 84
84
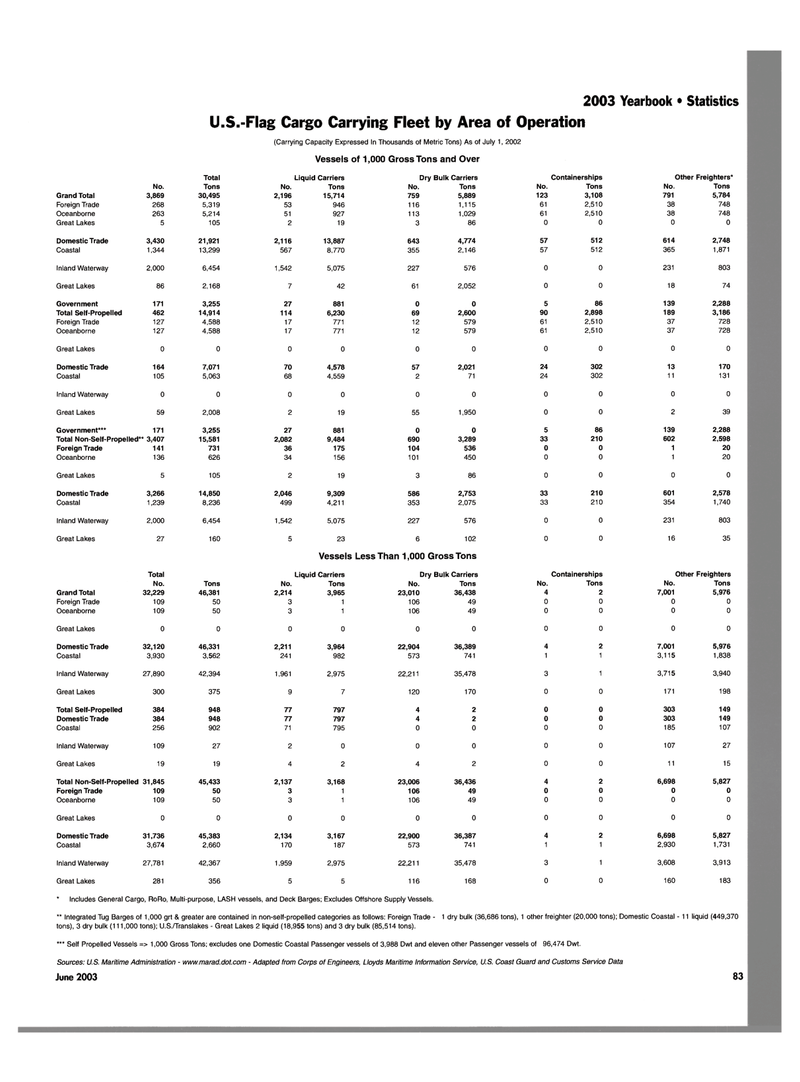
2003 Yearbook • Statistics
U.S.-Flag Cargo Carrying Fleet by Area of Operation (Carrying Capacity Expressed In Thousands of Metric Tons) As of July 1, 2002
Vessels of 1,000 Gross Tons and Over
Total — — • j
Liquid Carriers Dry Bulk Carriers Containerships Other Freighters*
No. Tons No. Tons No. Tons No. Tons No. Tons
Grand Total 3,869 30,495 2,196 15,714 759 5,889 123 3,108 791 5,784
Foreign Trade 268 5,319 53 946 116 1,115 61 2,510 38 748
Oceanborne 263 5,214 51 927 113 1,029 61 2,510 38 748
Great Lakes 5 105 2 19 3 86 0 0 0 0
Domestic Trade 3,430 21,921 2,116 13,887 643 4,774 57 512 614 2,748
Coastal 1,344 13,299 567 8,770 355 2,146 57 512 365 1,871
Inland Waterway 2,000 6,454 1,542 5,075 227 576 0 0 231 803
Great Lakes 86 2,168 7 42 61 2,052 0 0 18 74
Government 171 3,255 27 881 0 0 5 86 139 2,288
Total Self-Propelled 462 14,914 114 6,230 69 2,600 90 2,898 189 3,186
Foreign Trade 127 4,588 17 771 12 579 61 2,510 37 728
Oceanborne 127 4,588 17 771 12 579 61 2,510 37 728
Great Lakes 0 0 0 0 0 0 0 0 0 0
Domestic Trade 164 7,071 70 4,578 57 2,021 24 302 13 170
Coastal 105 5,063 68 4,559 2 71 24 302 11 131
Inland Waterway 0 0 0 0 0 0 0 0 0 0
Great Lakes 59 2,008 2 19 55 1,950 0 0 2 39
Government*** 171 3,255 27 881 0 0 5 86 139 2,288
Total Non-Self-Propelled" '* 3,407 15,581 2,082 9,484 690 3,289 33 210 602 2,598
Foreign Trade 141 731 36 175 104 536 0 0 1 20
Oceanborne 136 626 34 156 101 450 0 0 1 20
Great Lakes 5 105 2 19 3 86 0 0 0 0
Domestic Trade 3,266 14,850 2,046 9,309 586 2,753 33 210 601 2,578
Coastal 1,239 8,236 499 4,211 353 2,075 33 210 354 1,740
Inland Waterway 2,000 6,454 1,542 5,075 227 576 0 0 231 803
Great Lakes 27 160 5 23 6 102 0 0 16 35
Vessels Less Than 1,000 Gross Tons
Total Liquid Carriers Dry Bulk Carriers Containerships Other Freighters
No. Tons No. Tons No. Tons No. Tons No. Tons
Grand Total 32,229 46,381 2,214 3,965 23,010 36,438 4 2 7,001 5,976
Foreign Trade 109 50 3 1 106 49 0 0 0 0
Oceanborne 109 50 3 1 106 49 0 0 0 0
Great Lakes 0 0 0 0 0 0 0 0 0 0
Domestic Trade 32,120 46,331 2,211 3,964 22,904 36,389 4 2 7,001 5,976
Coastal 3,930 3,562 241 982 573 741 1 1 3,115 1,838
Inland Waterway 27,890 42,394 1,961 2,975 22,211 35,478 3 1 3,715 3,940
Great Lakes 300 375 9 7 120 170 0 0 171 198
Total Self-Propelled 384 948 77 797 4 2 0 0 303 149
Domestic Trade 384 948 77 797 4 2 0 0 303 149
Coastal 256 902 71 795 0 0 0 0 185 107
Inland Waterway 109 27 2 0 0 0 0 0 107 27
Great Lakes 19 19 4 2 4 2 0 0 11 15
Total Non-Self-Propelled 31,845 45,433 2,137 3,168 23,006 36,436 4 2 6,698 5,827
Foreign Trade 109 50 3 1 106 49 0 0 0 0
Oceanborne 109 50 3 1 106 49 0 0 0 0
Great Lakes 0 0 0 0 0 0 0 0 0 0
Domestic Trade 31,736 45,383 2,134 3,167 22,900 36,387 4 2 6,698 5,827
Coastal 3,674 2,660 170 187 573 741 1 1 2,930 1,731
Inland Waterway 27,781 42,367 1,959 2,975 22,211 35,478 3 1 3,608 3,913
Great Lakes 281 356 5 5 116 168 0 0 160 183 * Includes General Cargo, RoRo, Multi-purpose, LASH vessels, and Deck Barges; Excludes Offshore Supply Vessels. " Integrated Tug Barges of 1,000 grt & greater are contained in non-self-propelled categories as follows: Foreign Trade - 1 dry bulk (36,686 tons), 1 other freighter (20,000 tons); Domestic Coastal - 11 liquid (449,370 tons), 3 dry bulk (111,000 tons); U.S./Translakes - Great Lakes 2 liquid (18,955 tons) and 3 dry bulk (85,514 tons). *** Self Propelled Vessels => 1,000 Gross Tons; excludes one Domestic Coastal Passenger vessels of 3,988 Dwt and eleven other Passenger vessels of 96,474 Dwt.
Sources: U.S. Maritime Administration - www.marad.dot.com - Adapted from Corps of Engineers, Lloyds Maritime Information Service, U.S. Coast Guard and Customs Service Data
June 2003 83
