
Page 84: of Maritime Reporter Magazine (June 2003)
Read this page in Pdf, Flash or Html5 edition of June 2003 Maritime Reporter Magazine
 83
83
 85
85
2003 Yearbook • Statistics
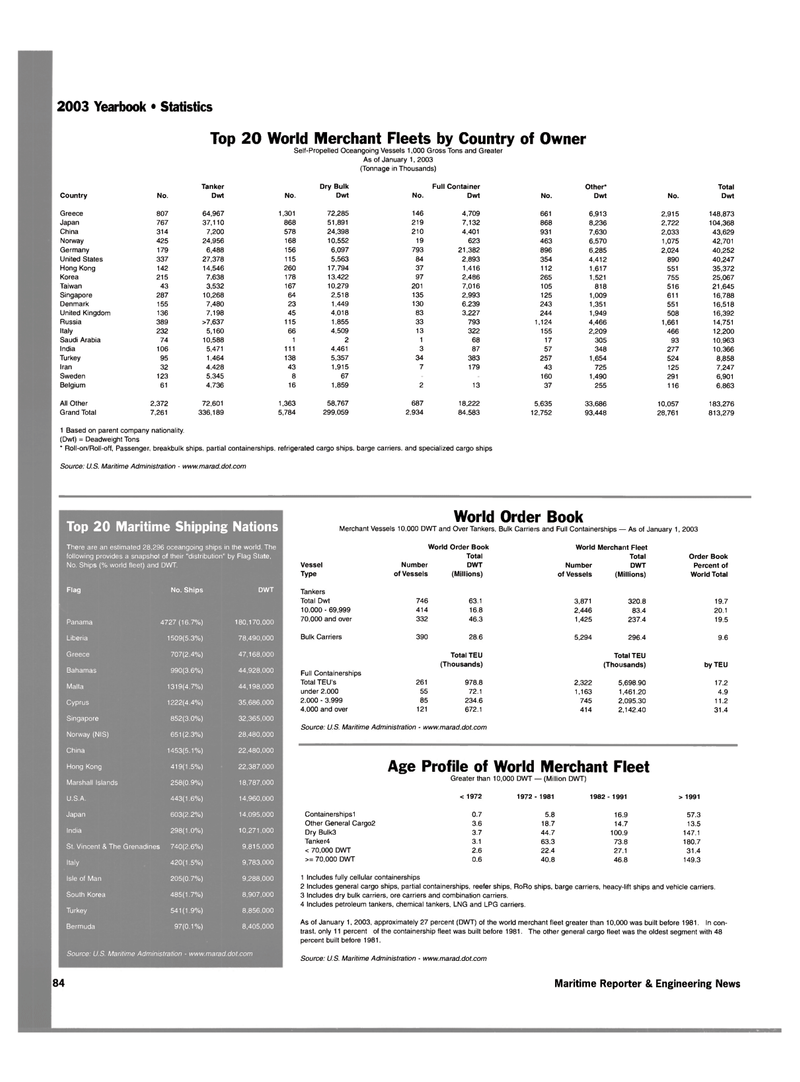
Top 20 World Merchant Fleets by Country of Owner
Self-Propelled Oceangoing Vessels 1,000 Gross Tons and Greater
As of January 1, 2003 (Tonnage in Thousands)
Tanker Dry Bulk Full Container Other* Total
Country No. Dwt No. Dwt No. Dwt No. Dwt No. Dwt
Greece 807 64,967 1,301 72,285 146 4,709 661 6,913 2,915 148,873
Japan 767 37,110 868 51,891 219 7,132 868 8,236 2,722 104,368
China 314 7,200 578 24,398 210 4,401 931 7,630 2,033 43,629
Norway 425 24,956 168 10,552 19 623 463 6,570 1,075 42,701
Germany 179 6,488 156 6,097 793 21,382 896 6,285 2,024 40,252
United States 337 27,378 115 5,563 84 2,893 354 4,412 890 40,247
Hong Kong 142 14,546 260 17,794 37 1,416 112 1,617 551 35,372
Korea 215 7,638 178 13,422 97 2,486 265 1,521 755 25,067
Taiwan 43 3,532 167 10,279 201 7,016 105 818 516 21,645
Singapore 287 10,268 64 2,518 135 2,993 125 1,009 611 16,788
Denmark 155 7,480 23 1,449 130 6.239 243 1,351 551 16,518
United Kingdom 136 7,198 45 4,018 83 3,227 244 1,949 508 16,392
Russia 389 >7,637 115 1,855 33 793 1,124 4,466 1,661 14,751
Italy 232 5,160 66 4,509 13 322 155 2,209 466 12,200
Saudi Arabia 74 10,588 1 2 1 68 17 305 93 10,963
India 106 5,471 111 4,461 3 87 57 348 277 10,366
Turkey 95 1,464 138 5,357 34 383 257 1,654 524 8,858
Iran 32 4,428 43 1,915 7 179 43 725 125 7,247
Sweden 123 5,345 8 67 160 1,490 291 6,901
Belgium 61 4,736 16 1,859 2 13 37 255 116 6,863
All Other 2,372 72,601 1,363 58,767 687 18,222 5,635 33,686 10,057 183,276
Grand Total 7,261 336,189 5,784 299.059 2.934 84,583 12,752 93,448 28,761 813,279 1 Based on parent company nationality. (Dwt) = Deadweight Tons * Roll-on/Roll-off, Passenger, breakbulk ships, partial containerships, refrigerated cargo ships, barge carriers, and specialized cargo ships
Source: U.S. Maritime Administration - www.marad.dot.com
World Order Book
Merchant Vessels 10,000 DWT and Over Tankers. Bulk Carriers and Full Containerships — As of January 1, 2003
Vessel
Type
Number of Vessels
World Order Book
Total
DWT (Millions)
World Merchant Fleet
Total
Number of Vessels
DWT (Millions)
Order Book
Percent of
World Total
Tankers
Total Dwt 10,000 - 69,999 70,000 and over 746 414 332 63.1 16.8 46.3 3,871 2,446 1,425 320.8 83.4 237.4 19.7 20.1 19.5
Bulk Carriers 390 28.6 5,294 296.4 9.6
Full Containerships
Total TEU's under 2.000 2.000 • 3.999 4.000 and over 261 55 85 121
Total TEU (Thousands) 978,8 72.1 234.6 672.1 2,322 1,163 745 414
Total TEU (Thousands) 5,698.90 1,461.20 2,095.30 2,142.40 by TEU 17.2 4.9 11.2 31.4
Source: U.S. Maritime Administration - www.marad.dot.com
Age Profile of World Merchant Fleet
Greater than 10,000 DWT — (Million DWT) < 1972 1972 - 1981 1982 - 1991 > 1991
Containershipsl 0.7 5.8 16.9 57.3
Other General Cargo2 3.6 18.7 14.7 13.5
Dry Bulk3 3.7 44.7 100.9 147.1
Tanker4 3.1 63.3 73.8 180.7 < 70,000 DWT 2.6 22.4 27.1 31.4 >= 70.000 DWT 0.6 40.8 46.8 149.3 1 Includes fully cellular containerships 2 Includes general cargo ships, partial containerships, reefer ships, RoRo ships, barge carriers, heacy-lift ships and vehicle carriers. 3 Includes dry bulk carriers, ore carriers and combination carriers. 4 Includes petroleum tankers, chemical tankers, LNG and LPG carriers.
As of January 1, 2003, approximately 27 percent (DWT) of the world merchant fleet greater than 10,000 was built before 1981. In con- trast. only 11 percent of the containership fleet was built before 1981. The other general cargo fleet was the oldest segment with 48 percent built before 1981.
Source: U.S. Maritime Administration - www.marad.dot.com
Top 20 Maritime Shipping Nations
There are an estimated 28,296 oceangoing ships in the world. The following provides a snapshot of their "distribution" by Flag State,
No. Ships (% world fleet) and DWT.
Flag No. Ships DWT
Panama 4727 (16.7%) 180,170,000
Liberia 1509(5.3%) 78,490,000
Greece 707(2.4%) 47,168,000
Bahamas 990(3.6%) 44,928,000
Malta 1319(4.7%) 44,198,000
Cyprus 1222(4.4%) 35,686,000
Singapore 852(3.0%) 32,365,000
Norway (NIS) 651 (2.3%) 28,480,000
China 1453(5.1%) 22,480,000
Hong Kong 419(1.5%) 22,387,000
Marshall Islands 258(0.9%) 18,787,000
U.S.A. 443(1.6%) 14,960,000
Japan 603(2.2%) 14,095,000
India 298(1.0%) 10,271,000
St. Vincent & The Grenadines 740(2.6%) 9,815,000
Italy 420(1.5%) 9,783,000
Isle of Man 205(0.7%) 9,288,000
South Korea 485(1.7%) 8,907,000
Turkey 541(1.9%) 8,856,000
Bermuda 97(0.1%) 8,405,000
Source: U.S. Maritime Administration - www.marad.dot.com 84 Maritime Reporter & Engineering News
