
Page 35: of Maritime Reporter Magazine (November 2010)
Workboat Annual
Read this page in Pdf, Flash or Html5 edition of November 2010 Maritime Reporter Magazine
 34
34
 36
36
Computational Fluid Dynamics (CFD) is playing an in- creasingly important role in today’s maritime industry.
Here MARIN explains its efforts to improve quality levels and outlines the next steps towards full 3D flow under- standing.
Nowadays, more complex flows are being calculated and these await comparison and validation with measured data.
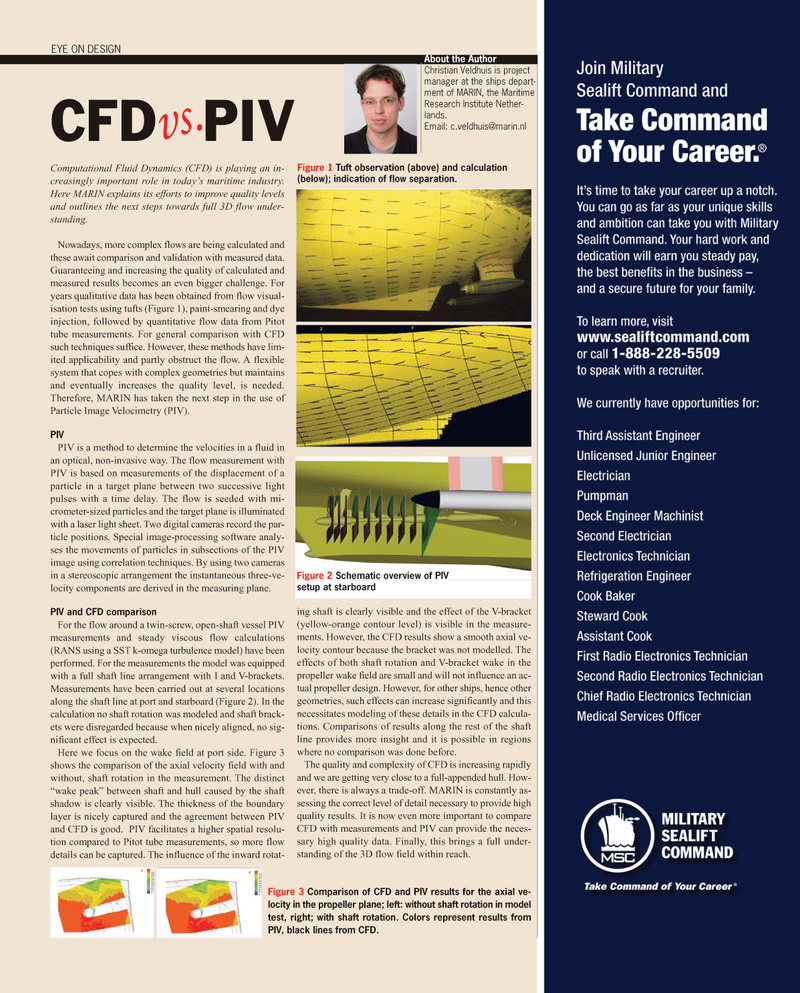
Guaranteeing and increasing the quality of calculated and measured results becomes an even bigger challenge. For years qualitative data has been obtained from flow visual- isation tests using tufts (Figure 1), paint-smearing and dye injection, followed by quantitative flow data from Pitot tube measurements. For general comparison with CFD such techniques suffice. However, these methods have lim- ited applicability and partly obstruct the flow. A flexible system that copes with complex geometries but maintains and eventually increases the quality level, is needed.
Therefore, MARIN has taken the next step in the use of
Particle Image Velocimetry (PIV).
PIV
PIV is a method to determine the velocities in a fluid in an optical, non-invasive way. The flow measurement with
PIV is based on measurements of the displacement of a particle in a target plane between two successive light pulses with a time delay. The flow is seeded with mi- crometer-sized particles and the target plane is illuminated with a laser light sheet. Two digital cameras record the par- ticle positions. Special image-processing software analy- ses the movements of particles in subsections of the PIV image using correlation techniques. By using two cameras in a stereoscopic arrangement the instantaneous three-ve- locity components are derived in the measuring plane.
PIV and CFD comparison
For the flow around a twin-screw, open-shaft vessel PIV measurements and steady viscous flow calculations (RANS using a SST k-omega turbulence model) have been performed. For the measurements the model was equipped with a full shaft line arrangement with I and V-brackets.
Measurements have been carried out at several locations along the shaft line at port and starboard (Figure 2). In the calculation no shaft rotation was modeled and shaft brack- ets were disregarded because when nicely aligned, no sig- nificant effect is expected.
Here we focus on the wake field at port side. Figure 3 shows the comparison of the axial velocity field with and without, shaft rotation in the measurement. The distinct “wake peak” between shaft and hull caused by the shaft shadow is clearly visible. The thickness of the boundary layer is nicely captured and the agreement between PIV and CFD is good. PIV facilitates a higher spatial resolu- tion compared to Pitot tube measurements, so more flow details can be captured. The influence of the inward rotat- ing shaft is clearly visible and the effect of the V-bracket (yellow-orange contour level) is visible in the measure- ments. However, the CFD results show a smooth axial ve- locity contour because the bracket was not modelled. The effects of both shaft rotation and V-bracket wake in the propeller wake field are small and will not influence an ac- tual propeller design. However, for other ships, hence other geometries, such effects can increase significantly and this necessitates modeling of these details in the CFD calcula- tions. Comparisons of results along the rest of the shaft line provides more insight and it is possible in regions where no comparison was done before.
The quality and complexity of CFD is increasing rapidly and we are getting very close to a full-appended hull. How- ever, there is always a trade-off. MARIN is constantly as- sessing the correct level of detail necessary to provide high quality results. It is now even more important to compare
CFD with measurements and PIV can provide the neces- sary high quality data. Finally, this brings a full under- standing of the 3D flow field within reach.
About the Author
Christian Veldhuis is project manager at the ships depart- ment of MARIN, the Maritime
Research Institute Nether- lands.
Email: [email protected]
EYE ON DESIGN
CFD PIV
Figure 3 Comparison of CFD and PIV results for the axial ve- locity in the propeller plane; left: without shaft rotation in model test, right; with shaft rotation. Colors represent results from
PIV, black lines from CFD.
Figure 1 Tuft observation (above) and calculation (below); indication of flow separation.
Figure 2 Schematic overview of PIV setup at starboard vs .
