Page 53: of Maritime Reporter Magazine (June 2014)
Annual World Yearbook
Read this page in Pdf, Flash or Html5 edition of June 2014 Maritime Reporter Magazine
? eld offshore Sarawak. The lease day rate is $144,500 over the initial ? rm pe- riod of the lease.
The partially completed Deep Produc- er 1 will be used for the Layang project.
This had been a speculative FPSO con- version contracted by FPSOcean with
Dubai Drydocks in 2006. FPSOcean could not obtain a ? eld contract, ran out of money and could not ? nd a buyer for the unit – and in February 2009 ? led for bankruptcy protection. Malaysia-based
TH Heavy Eng. acquired the unit in Oc- tober 2011 for $82.5m for use on mar- ginal oil? elds. Delivery of the 68 pro- duction ? oaters now on order is spread over the next ? ve years. The units with delivery furthest out are the three ? nal
FPSOs in the eight serial hulls on order in Brazil, a TLP being designed for use in the GOM and an FLNG for use in Ma- laysia. These ? ve units are scheduled for completion in 2018.
Backlog of Planned Floater Projects
In total 224 ? oating production proj- ects are in various stages of planning as of beginning June 2014. Of these, 58% involve an FPSO, 14% another type oil/ gas production ? oater, 22% liquefaction or regasi? cation ? oater and 6% storage/ of? oading ? oater.
Brazil, Africa and SE Asia continue to be the major locations of ? oating pro- duction projects in the visible planning stage. We are tracking 44 projects in
Brazil, 48 in Africa and 38 projects in
SEA – 58% of the visible planned ? oat- ing production projects worldwide.
Several large projects in Brazil will entail use of multiple production units.
Development of the Libra complex, which is counted as one project, could require as many as 18 FPSOs. The
Lula and Jupiter complexes could each require three to six FPSOs. So while
Africa currently has greatest number of projects in the planning stage, Brazil clearly leads in number of future produc- tion units required. Around 14% of the 224 visible planned projects are likely to advance to the EPC contracting stage within the next 12 months. These near term projects typically have either en- tered the FEED phase, pre-quali? cation of ? oater contractors has been initiated or bidding/negotiation is in progress.
Another 50% of the visible projects are at a stage of development where the EPC contract for the production unit is likely within the next two to ? ve years. The remaining projects are less advanced in planning, with the EPC contract likely ? ve to 10 years out.
Near term projects vary signi? cantly by region. Brazil will likely produce at least ? ve major contract awards for FP-
SOs over the next year. Africa has three major FPSO contracts pending. SEA has eight contracts in the near term, mostly
FSOs. The U.S. GOM will likely pro- duce contracts for several FLNG ex- port terminals and two major produc- tion ? oaters. The Mexican GOM will require two major FPSOs. Northern
Europe will likely produce orders for several FSOs and a cylindrical FPSO.
The Mediterranean will produce a major
FPSO contract. A list of near term proj- ects is provided on the following page, and for each project the likely lease/buy acquisition strategy and mooring system is indicated. Please note that the list is a snapshot as of beginning June. Informa- tion in the list changes as more details come available.
The Floater Forecast
At the beginning of each year we fore- cast the number of production ? oater or- ders likely over the next ? ve years. The forecast is based on our analysis of (1) projects in the planning cycle that appear ready to move to the contracting stage and (2) future underlying market condi- tions that will impact the timing of the www.marinelink.com 53
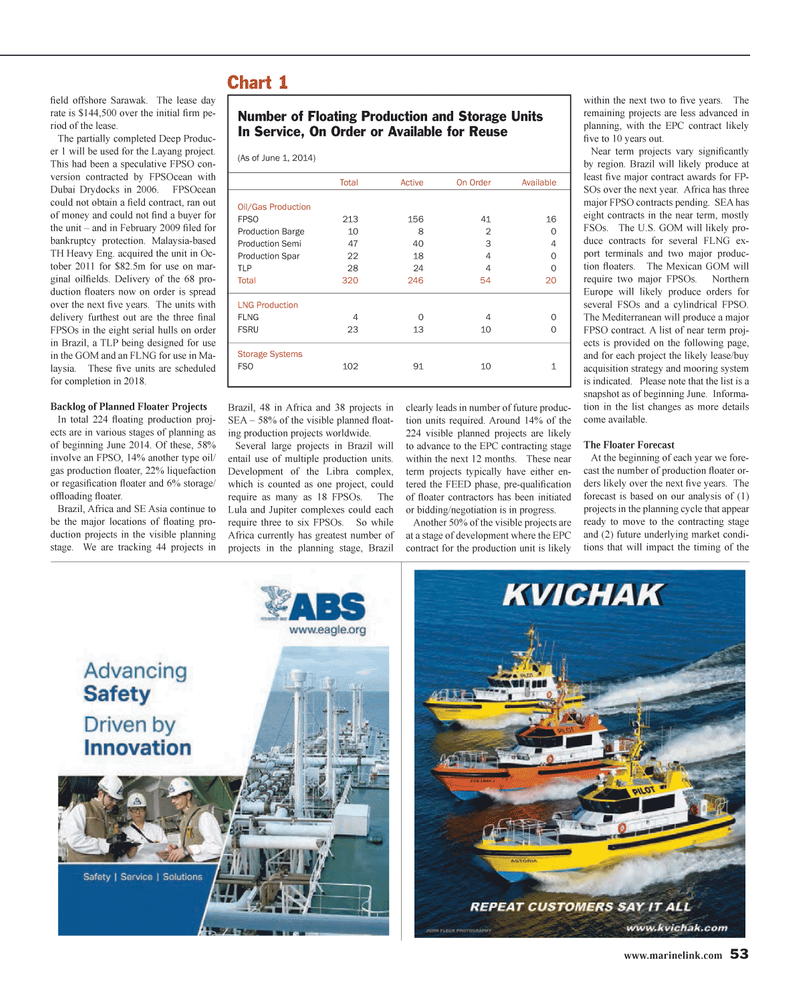
Number of Floating Production and Storage Units
In Service, On Order or Available for Reuse (As of June 1, 2014) Total Active On Order Available
Oil/Gas Production
FPSO 213 156 41 16
Production Barge 10 8 2 0
Production Semi 47 40 3 4
Production Spar 22 18 4 0
TLP 28 24 4 0
Total 320 246 54 20
LNG Production
FLNG 4 0 4 0
FSRU 23 13 10 0
Storage Systems
FSO 102 91 10 1
Chart 1
MR #6 (50-57).indd 53 6/9/2014 11:53:44 AM

 52
52

 54
54
