
Page 60: of Maritime Reporter Magazine (December 2015)
Great Ships of 2015
Read this page in Pdf, Flash or Html5 edition of December 2015 Maritime Reporter Magazine
 59
59
 61
61
TECH FILES
Optimizing Ship Performance via Monitoring Systems hip owners want to operate ships propulsion ef? ciency, EEOI and propel- Energy Ef? ciency Operational cargo condition. It is necessary classify ef? ciently to keep fuel con- ler slip. Index the data to make a reliable study. All the sumption, and as a consequence, The EEOI is the ratio of mass of CO2 statistical analyses must be compared
Satmospheric emissions levels Speci? c Fuel Rate, SFR emitted per unit of transport work. The against some reference bases. These ref- low. Ship owners and crews obtain a The SFR is de? ned as the quantity of EEOI should be a representative value erences are the design data of the ships, reliable monitoring of the atmospheric fuel consumed by M/E (by weight) to of the energy ef? ciency of the ship op- and benchmark data collected after de- emissions controlling the fuel con- produce one unit of power in one unit eration over a consistent period, which livery and/or after any major mainte- sumption for main engine and auxiliary of time. Many factors affect the SFR represents the overall trading pattern of nance or repair of the ships. engines, mainly. By using ship perfor- including engine design, load factors the vessel. It is required to de? ne a roll- mance monitoring systems (SPM), it is that depend on engine use characteris- ing average indicator using a minimum SPM System demonstrated that the ships can save 6% tics, and auxiliary technologies. A small number of voyages that is statistically In order to show and explain the bene- in fuel consumption, which translates improvement in SFR shows signi? cant relevant. ? ts of using a ship performance monitor- into large ? nancial savings and emission cost savings in fuel. Thus, if the SFR im- ing systems, pro? led here is the software reductions. proves, the atmospheric emissions will Propeller Slip offered by the Norwegian company, decrease in consequence. Technically, The propeller slip is de? ned as the dif- Kyma a.s. With head of? ce in Bergen,
What is a SPM? the most optimal performance range to ference between the theoretical distance Kyma a.s, is a leaders on ship perfor-
SPM is one computer and data logger operate the M/E is between 75-85% of that the propeller should travel in one mance monitoring systems. It offers interfaced with several sensors onboard its Maximum Continuous Rate. revolution and the actual distance the products with the evaluation of the ship allowing the continuous recording of vessel travels. Other de? nition may be performance status. One product is the the inputs for analysis of the ship per- Overall Ship Ef? ciency the difference between the speed of the Kyma Ship Performance (KSP). KSP of- formance status. The required inputs This parameter indicates the amount of vessel and the speed of the engine. Any fers to the crew different information in (minimum) for the SPM are: fuel necessary to sail one nautical mile. change on ship’s speed and/or propeller order to evaluate the ship performance at • Power delivered to propeller To evaluate this performance indicator revolutions cause change on the propel- any time and during the ship’s life. It is • Fuel consumption of main engine with design data, it is necessary look at ler slip. Therefore, analysing the value of shown numerical data, reference curves • Environment conditions two reference curves made from design the propeller slip, they can evaluate the and short trend data. The logging time
The SPM offer numerical values and data, these are “SFR vs Power” (see ? g- hydrodynamic status of the ship. With used by Kyma is every 15 seconds; it graphical information, and the latest ure 1) and “Power vs Ship’s speed” (see bad weather condition or strong sea cur- means that the numbers on the KSP are
SPM systems offer the option to make ? gure 5). rent, the evaluation of the performance updated every 15 seconds with the av- a statistical analysis of the main perfor- indicator would be no reliable or that erage data recorded during this logging mance. The SPM should generate fuel Propulsion Ef? ciency could falsify the results obtained. time.
reports per day and per voyage. This performance parameter is show- Numerical data give to the crew clear ing how many kilowatts are being used Statistical Analysis in SPM information about the actual status of the
Performance Indicators to sail one nautical mile. This parameter Per de? nition, statistical analysis re- ship and the total values per voyage. It
Calculated by SPM will decrease with the passage of the fers to the setup methods used to process is also represented the short trend data
The performance indicators are those time due to the hull will lose ef? ciency large amounts of data. It is particularly graphically. These graphics show the variables calculated automatically for (degradation of coating, accumulation of useful when dealing with unsteady data. behaviour of any parameter for a short the SPM and give useful information fouling, etc.). In addition, reduction on It is important to implement ? ltering period (from minutes to 14 days). Other about the actual vessel performance. propeller performance and on the M/E to avoid useless data that could invali- information available on KSP are the
The main performance indicators to be ef? ciency will cause variations on this date the long trend analysis. The ? lter- reference curves (design condition), analyzed are the M/E speci? c fuel rate performance indicator. ing should take into account the weather these baselines are: (SFR), Ship overall ef? ciency (SOE), condition, main engine power and ship’s • FO consumption vs. Ship´s speed
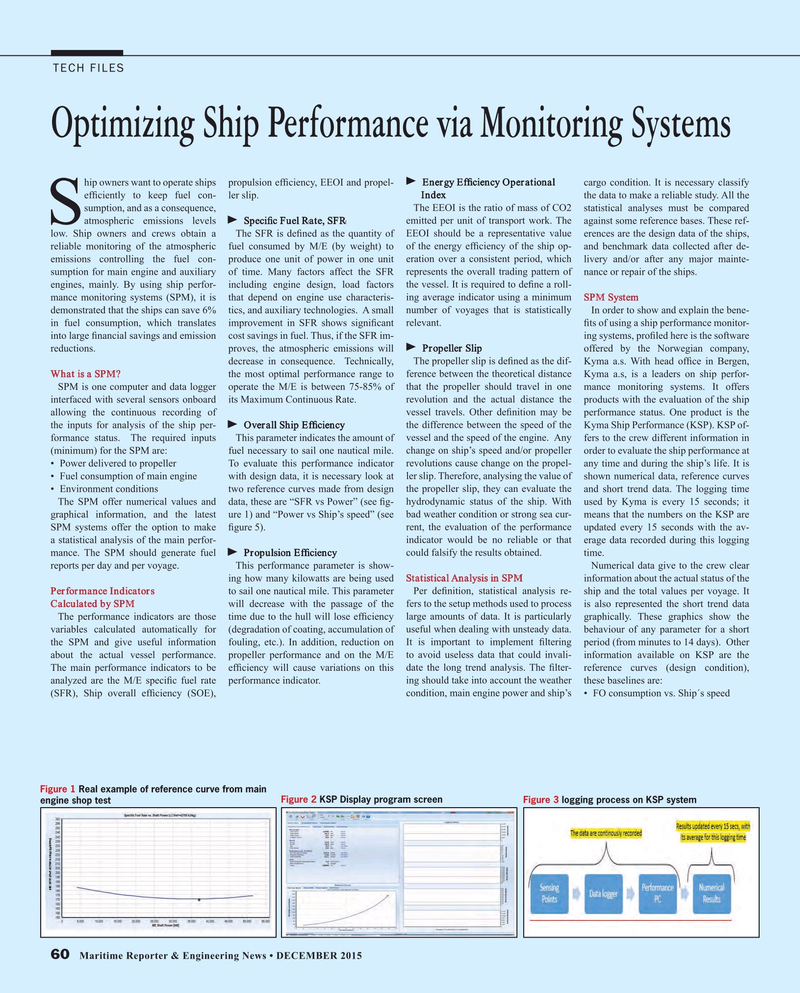
Figure 1 Real example of reference curve from main engine shop test Figure 2 KSP Display program screen Figure 3 logging process on KSP system 60 Maritime Reporter & Engineering News • DECEMBER 2015
MR #12 (58-65).indd 60 12/4/2015 2:14:49 PM
