
Page 61: of Maritime Reporter Magazine (December 2015)
Great Ships of 2015
Read this page in Pdf, Flash or Html5 edition of December 2015 Maritime Reporter Magazine
 60
60
 62
62
• Shaft Power vs. RPM over the time due to the hull performance (major events that will modify the ship • Shaft Power vs Ship´s speed is getting worse with the time passage, performance), for example, dry dock- • SFR vs. Power and then speed loss appears. The best ing periods. The blue lines are info way to evaluate and analyse this speed events (they have not in? uence on the
Baseline “FO consumption vs. loss is by means of statistical analysis. trend analysis) such as “leaving port”,
Ship´s speed” “Change HFO-MDO”, etc. To make an
This baseline could be used to see if ship Baseline “SFR vs. Shaft Power” accurate analysis, it is important to in- is being operated following the terms This baseline is made with the M/E clude the trend events carried out on the of the time charter parties (TCP) agree- workshop test report data. The SFR used ships. Is also essential to establish the ments. In addition, looking this baseline from the main engine workshop report reference level that allow seeing the de- the crew can analyze if the ship is sailing is the value corrected at reference lower viation of the trend data to be analyzed. in the most optimal mode to achieve the heating value of 42,700 kJ/kg. It is used The solution commonly adopted is to
TCP agreement. as referent value because the ships will compare with two reference bases, one use different low heating values (differ- constant and one dynamic.
Baseline “Shaft Power vs. RPM” ent fuels type, different fuel qualities, 1. Constant: this is the reference curves
There are basically, two conditions to etc.) then it is required to standardize in KSP. This data designates the “zero be considered if the RPM are out of the the baseline. The reference value for level.” This level is constant for all the optimal condition. low heating value determinate by ISO is ship life.
The Author 1. Higher RPM: It might indicate that 42,700 kJ/kg. See ? gure 1 for reference. 2. Dynamic: this level corresponds with the propeller is too small or too light. the benchmark periods. The benchmark-
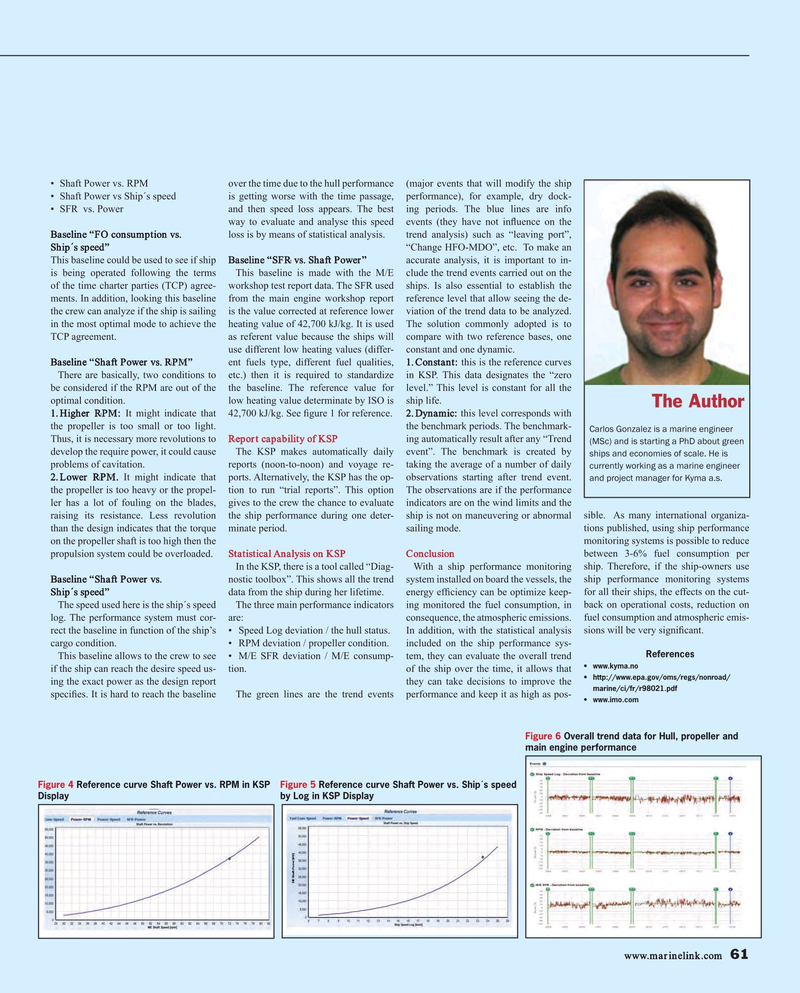
Carlos Gonzalez is a marine engineer
Thus, it is necessary more revolutions to Report capability of KSP ing automatically result after any “Trend (MSc) and is starting a PhD about green develop the require power, it could cause The KSP makes automatically daily event”. The benchmark is created by ships and economies of scale. He is problems of cavitation. reports (noon-to-noon) and voyage re- taking the average of a number of daily currently working as a marine engineer 2. Lower RPM. It might indicate that ports. Alternatively, the KSP has the op- observations starting after trend event. and project manager for Kyma a.s.
the propeller is too heavy or the propel- tion to run “trial reports”. This option The observations are if the performance ler has a lot of fouling on the blades, gives to the crew the chance to evaluate indicators are on the wind limits and the raising its resistance. Less revolution the ship performance during one deter- ship is not on maneuvering or abnormal sible. As many international organiza- than the design indicates that the torque minate period. sailing mode. tions published, using ship performance on the propeller shaft is too high then the monitoring systems is possible to reduce propulsion system could be overloaded. Statistical Analysis on KSP Conclusion between 3-6% fuel consumption per
In the KSP, there is a tool called “Diag- With a ship performance monitoring ship. Therefore, if the ship-owners use
Baseline “Shaft Power vs. nostic toolbox”. This shows all the trend system installed on board the vessels, the ship performance monitoring systems
Ship´s speed” data from the ship during her lifetime. energy ef? ciency can be optimize keep- for all their ships, the effects on the cut-
The speed used here is the ship´s speed The three main performance indicators ing monitored the fuel consumption, in back on operational costs, reduction on log. The performance system must cor- are: consequence, the atmospheric emissions. fuel consumption and atmospheric emis- rect the baseline in function of the ship’s • Speed Log deviation / the hull status. In addition, with the statistical analysis sions will be very signi? cant.
cargo condition. • RPM deviation / propeller condition. included on the ship performance sys-
References
This baseline allows to the crew to see • M/E SFR deviation / M/E consump- tem, they can evaluate the overall trend • www.kyma.no if the ship can reach the desire speed us- tion. of the ship over the time, it allows that • http://www.epa.gov/oms/regs/nonroad/ ing the exact power as the design report they can take decisions to improve the marine/ci/fr/r98021.pdf speci? es. It is hard to reach the baseline The green lines are the trend events performance and keep it as high as pos- • www.imo.com
Figure 6 Overall trend data for Hull, propeller and main engine performance
Figure 4 Reference curve Shaft Power vs. RPM in KSP Figure 5 Reference curve Shaft Power vs. Ship´s speed
Display by Log in KSP Display www.marinelink.com 61
MR #12 (58-65).indd 61 12/4/2015 2:15:04 PM
