
Ice Kings: Model Testing Ship-ice Interactions
By Andrew Safer
Model testing ship-ice interactions in the St. John’s ice tank
In a cavernous room in the heart of a research center in St. John’s, Newfoundland at 8 am, the air temperature is -20 C while the water temperature is hovering at zero. National Research Council of Canada (NRC) staff are preparing the Ice Tank to test the integrity of a newly designed ship’s hull and propulsion system by subjecting a model to a battery of maneuvers and encounters with ice. One of the largest in the world, the Ice Tank is 90m long, 12m wide, and 3m deep. Once ideal conditions for “growing ice” are achieved, a fog of a proprietary ice-making mixture is hand sprayed into the air as a mist that freezes and then falls onto the water’s surface. On contact, the droplets morph into fine smaller crystals that begin to grow vertically downward, matching the formation of ice in Nature where its columnar structure develops from snow or ice crystals. The NRC ice was specifically designed to fracture vertically, like ice in the real world.
In the 1980s, scientists at NRC developed the special concoction to avoid using salt water, which is corrosive and would negatively impact the Ice Tank’s elaborate infrastructure. Facilities Manager Ian Robbins explains that the ice formula, referred to as EGADS, includes a) water, b) ethylene glycol (antifreeze), c) aliphatic detergent (soap), and d) sugar (no longer part of the recipe). EGADS was developed to mimic the scale properties of sea ice. The mechanical properties of real sea ice that matter to an icebreaking vessel – its flexural strength, compressive strength, cracking behavior, friction, etc. – are all emulated at model scale by the model EGADS ice that is formed in the Ice Tank. The model scale ice was compared to tests on real sea ice from the Arctic in order to validate the recipe.
Growing initially at a rate of 2-3mm every three hours, a 20mm ice sheet takes 8-10 hours to form. The material is stronger than desired, so to weaken it, the testing team turns off the refrigeration plant and turns on the heat. Their aim is to hit the ice strength target between 9 and 10 am. A bubble carriage blows air bubbles into the tank from the bottom. They become frozen in the ice, lessening the density. The target ice thickness, which reflects the real-world conditions the vessel will be working in, is dictated by both the scale factor used for the model and the test plan that is developed in consultation with the client.
Dr. Jim Millan, NRC Director of Research and Development, explains that a typical icebreaker-testing project might require anywhere from a few ice sheets to 20 or more, which support testing over a 1- to 12-week period. Once the contract is signed and the test plan is developed, designers and electronics, software, and instrumentation technicians and engineers work together as a team to design and build the model hull, appendages, propulsion system, sensors, autopilot control, and any other specialized systems that need to go into the model to make it work. From start to finish, in five to eight weeks, depending on complexity, the model is built in a purpose-built facility and is ready for testing. Once the software and electronics and instrumentation systems are installed to run the model and acquire data, the model is tested.
The majority of NRC’s models are built at a scale ranging from 1:25 to 1:40. Froude scaling laws are used, which ensures that forces and other quantities measured at model scale can be used to reliably predict the same quantities at full scale. “The closer to real (full) scale,” notes Dr. Millan, “the model gets too big. The beauty of physical modeling,” he adds, “is that if you get the strength and thickness of the ice right, you get the physics for free.” A 150m ship at 1:25 model scale would be 6 meters long, whereas the same ship modeled at 1:10 would require a model that is 15 meters long, which is too big for the tank. Sometimes they build more than one model to compare design features. For an icebreaker, there could be two kinds of bows, represented either by two models or by one model and two bows, which are alternately bolted on. With smaller models, Dr. Millan says, it can be difficult to fit all of the electronics, sensors, and other on-board equipment inside.
Plotting the data that’s acquired throughout the test process is not being done in order to find a single number – the answers are more complex and require specialized analysis and interpretation of the results. “A very specialized graduate degree in engineering is required to plot the trends,” says Dr. Millan. “There could be a particular outcome, or you could have variables that are a function of multiple parameters, such as thickness, strength of ice, and the speed you’re trying to go through the ice. The question could be: How does power vary as a function of each parameter?” To achieve this, NRC runs a refrigeration plant and has staff who take samples and test flexural strength and the friction of the ice. “It’s like a huge science experiment,” Dr. Millan observes. “and there are people with up to 30 years’ experience who are able to operate in a multidisciplinary team.” The work is done behind the scenes, so that “when the client comes in, the joystick is ready to grab” (to drive the model), and the data collection can begin.
Before initiating the model testing route with a client, NRC investigates available historical data to see if the questions that are being asked can be satisfactorily answered that way. Using specially-developed numerical modeling programs such as NRC’s Particle-in-Cell (PIC) pressured ice model, they can also predict some results ahead of the model test. Such modeling can help to guide the model test to ensure it focusses on the most important test conditions. . All models – numerical and physical - require validation. Froude’s scaling methods for ships in open water are “extremely well validated”, observes Dr. Millan, and have been used for 150 years. However, such data for icebreaking vessels is not as readily available . NRC’s historical icebreaker performance data, and the validation of their physical modeling work, can be traced to a number of sea trials conducted on eight different vessels in a variety of ice conditions in Canadian waters. “What we’re doing with the physical models has already been validated by these eight vessels,” Dr. Millan explains. The small amount of historical data that’s available, he adds, is due to the considerable expense of instrumenting ships in real-world conditions. “My vision for the future will depend on the collection of large quantities of field data,” he adds— “not to get away from using physical modeling, but to make it better.” NRC has done testing and evaluation work for Newfoundland’s four offshore oil projects, each having been tested in the Ice Tank . The numerical and physical modeling they’ve used for offshore structures have been validated by structure data collected in the Beaufort Sea in the 1980s and 1990s. This sort of data is even rarer than icebreaking ship data, Dr. Millan notes.
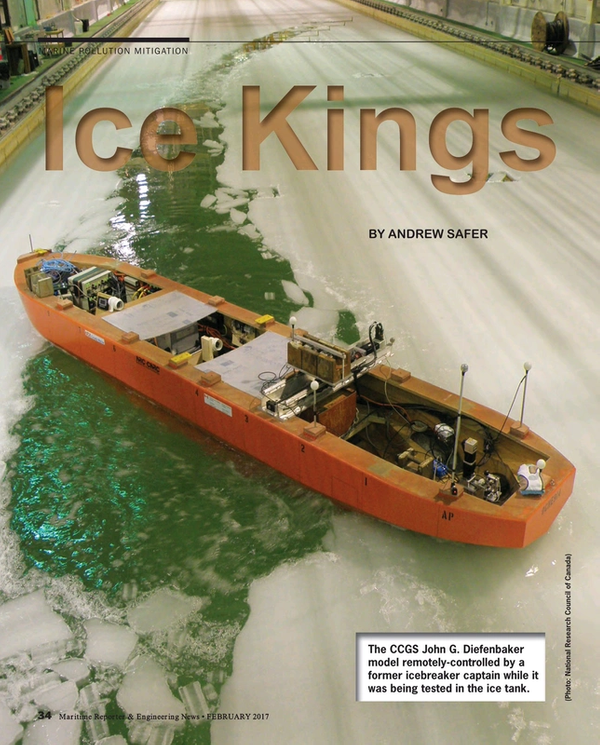
When, in 2010, the Canadian Coast Guard (CCG) was working on the preliminary design of Canada’s Polar Icebreaker CCGS John G. Diefenbaker, they sought the assistance of NRC. The vessel, which measures 150m length, 20m beam, and draft of 10.5m, will be built to extend the season of current icebreakers in the Canadian Arctic from seven to nine months. CCG staff studied both Canadian and US historical ice and weather data going back 60 years to determine the variety of ice conditions, and, in consultation with NRC, established the design criteria. The vessel needed to be capable of breaking 2.5 meters of level ice while making continuous progress at 3 knots. The characterization of ice included flexural strength, density, and temperature profiles. “We looked at the different physical phenomena that could occur in the real world using the historical data,” recalls Derek Buxton, project manager of CCG’s Polar Icebreaker Project. “That included pressurized ice, ridges, rubble fields, and the historical movement of ice floes through the Canadian Arctic archipelago.” Ice Tank testing was carried out in three phases: 1) towed experiments: the model was attached to the carriage for measuring resistance to ice in different conditions, 2) controlled mode: it was detached from the carriage, conducting maneuvers that icebreakers are required to do, and 3) demonstration phase: testing specific maneuvers like breaking out from being frozen in ice and extricating itself. Underwater high-definition video displayed on a monitor showed how ice moved along the vessel and how it was introduced into the propellers. Mr. Buxton and his colleagues and NRC staff viewed this in real time.
To conduct tests in broken ice, NRC Facilities Manager Ian Robbins and his staff used handsaws to cut 5m floes (representing 100m full scale), and electric chain saws to cut thicker ice. To create pack ice that represents 20m thick ice at full-scale, “we jam ice together to simulate a brash ice pack or ridge with a sail and keel,” explains Mr. Robbins. Then they turn the plant on to freeze the consolidated mass for four or five hours. Using a free-running model, they see how long it takes for the model to break through with a ramming maneuver, and to extract itself.
Mr. Buxton notes the difficulty of reconciling the differences between the Ice Tank and the real world, such as basing the tests on a level homogeneous 2.5m ice thickness “which just doesn’t exist”. The solution was to rely on the expertise within CCG. An operational working group to support the project was composed of commanding officers from icebreaking vessels with over 300 years combined experience in the Canadian Arctic.
Based on Ice Tank tests of both a slope-sided hull form and one that had a knuckle at the ice waterline, CCG picked the latter, which demonstrated superior maneuvering characteristics and self-extraction capabilities.
The preferred propulsion system had two traditional shafts on the outside (port and starboard) and an azimuthing thruster at the centerline, compared to the one with three traditional shafts and a rudder. Tests revealed some challenges and permitted the design to be tweaked to ensure optimal performance. In one instance, “We went back to the drawing board,” Mr. Buxton says, “and modified the stern arrangements—the shape and pod strut configuration, which dramatically improved the astern icebreaking performance.”
NRCC built three different models, which were tested, modified, and then tested again to determine the final design. Asked his impression of the facilities, Mr. Buxton says, “Tremendous. Phenomenal. It’s the only place in the world where you can do three types of testing in one facility,” referring to the Ice Tank, Tow Tank, and Ocean Engineering Basin, where various sea states can be introduced on a variety of headings. One: 25 scale models were tested in the Tow Tank and Ice Tank, and a 1:33 scale model was tested in the Ocean Engineering Basin. The model testing of the Diefenbaker spanned three years, ending in 2013.
Mentioning there are very few relevant examples of icebreakers in the real world, and even less data, Mr. Buxton says, “These guys are superb. They have the experience. On a project of this magnitude, it was tremendously important for us to have a competent partner.” He adds that on a project of this scale, it is considered international best practice to test in more than one facility, so CCG had some tests carried out at the AARC Ice Tank in Helsinki. “We got corroborating results,” he says, “which speaks to our overall confidence in the work that was done.”
Dr. Millan notes that the project cost for model testing and evaluation is generally in the hundreds of thousands of dollars, but could run much higher depending on the number of models and ice sheets required to collect the data needed to answer the client’s questions. Considering that the total estimated budget for the Diefenbaker project is $1.3 billion, Mr. Buxton said that the sizable investment “was a small price to pay for the assurance that it provides.”
Read Ice Kings: Model Testing Ship-ice Interactions in Pdf, Flash or Html5 edition of February 2017 Maritime Reporter
Other stories from February 2017 issue
Content
- Coral Reefs: A Unique Natural Resource page: 12
- Oily Water Separator Systems: Practical Advice page: 14
- Last Port of Call for the U.S. Merchant Marine? page: 16
- Inside Brazil's Cuise Slump page: 20
- Meyer Turku Builds Big page: 24
- ABB: Propelling the Polar Cruise Boom page: 26
- Interview: Tan Sri Kt Lim, Chairman, Genting Hong Kong page: 33
- Ice Kings: Model Testing Ship-ice Interactions page: 34
- How Eagle Bulk Shipping is Using Big Data page: 38
- Rolls-Royce Blue Ocean Team Looks to the Future page: 40
- Industry 4.0 on the High Seas page: 43
- Digital Tech Turning Around Marine Prospects in Uncertain Waters page: 43
- KVH Is On 'Watch' page: 46
- Offshore Innovation: A Real ‘Riverboat’ page: 48
