Maritime Transportation Industry
-
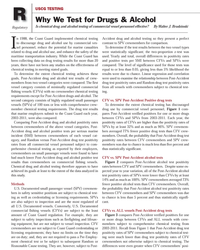
- Why We Test for Drugs & Alcohol Maritime Logistics Professional, Q3 2013 #50
Is chemical drug and alcohol testing of commercial vessel personnel effective?
In 1988, the Coast Guard implemented chemical testing to discourage drug and alcohol use by commercial vessel personnel, reduce the potential for marine casualties related to drug and alcohol use, and enhance the safety of the maritime transportation industry. While the Coast Guard has been collecting data on drug testing results for more than 20 years, there have not been any studies on the effectiveness of chemical testing in meeting stated goals.
To determine the extent chemical testing achieves these goals, Post-Accident drug and alcohol test results of crewmembers from two vessel categories were compared. The first vessel category consists of minimally regulated commercial fishing vessels (CFVs) with no crewmember chemical testing requirements except for Post-Accident drugs and alcohol. The second category consists of highly regulated small passenger vessels (SPVs) of 100 tons or less with comprehensive crewmember chemical testing requirements. The drug test results that marine employers submit to the Coast Guard each year, 2003-2011, were also compared.
Comparing Post-Accident drug and alcohol positivity rates between crewmembers of the above vessel categories, Post-Accident drug and alcohol positive tests per serious marine incident (SMI) between crewmembers of each vessel category, and Random versus Post-Accident drug test positivity rates from all commercial vessel personnel subject to comprehensive chemical testing as reported by their employers, crewmembers on small passenger vessels were found to have had much lower Post-Accident drug and alcohol positive test results than crewmembers on commercial fishing vessels. Chemical drug and alcohol testing therefore appears to have achieved its goals at least to the extent of the data analyzed in this study.
Methods
U.S. Documented small passenger vessel (SPV) crewmembers in safety sensitive positions are subject to chemical testing as well as credentialing or licensing requirements. SPVs are also subject to inspection and are the most regulated of all U.S. Documented vessels. Conversely, U.S. Documented commercial fishing vessels (CFVs) are subject to the least amount of Coast Guard regulation. For example, they are subject to safety inspections such as firefighting and lifesaving equipment, but are not subject to vessel inspection. CFV crewmembers are not subject to Coast Guard credentialing or licensing requirements; they have no limits on the time they are on duty; and, they are not required to pass a Pre-Employment chemical test or be subject to subsequent Random or Reasonable Cause testing. They are, however, subject to Post-Accident drug and alcohol testing so they present a perfect contrast to SPV crewmembers for comparison.
To determine if the test results between the two vessel types were statistically significant; the two-proportion z-test was used. Yearly and total, overall differences in positivity rates and positive tests per SMI between CFVs and SPVs were compared. The level of significance used for those tests was equal to or less than 0.05, giving less than 5% likelihood the results were due to chance. Linear regression and correlation were used to examine the relationship between Post-Accident drug test positivity rates and Random drug test positivity rates from all vessels with crewmembers subject to chemical testing.
CFV vs. SPV Post-Accident Positive drug tests
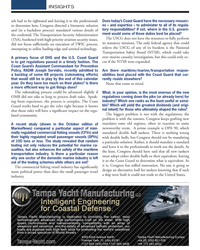
To determine the extent chemical testing has discouraged drug use by commercial vessel personnel, Figure 1 compares Post-Accident verified positives for one or more drugs between CFVs and SPVs from 2003-2011. Each year, the positivity rates of CFVs are higher than the positivity rates of SPVs by at least 32% and as much as 96%. SPV crewmembers averaged 77% fewer positive drug tests than CFV crewmembers. Overall, the probability that Post-Accident drug test positivity rates between CFV crewmembers and SPV crewmembers was due to chance is much less than five percent and thus statistically significant.
CFV vs. SPV Post-Accident alcohol tests
Figure 2 compares Post-Accident alcohol test positivity rates between CFV and SPV crewmembers. Despite some expected year to year variation, all of the Post-Accident alcohol test positivity rates of SPVs were lower than CFVs by at least 14% and as much as 100%. SPV crewmembers averaged 73% fewer positive alcohol tests than CFV crewmembers. Overall, the probability that Post-Accident alcohol test positivity rates between CFV crewmembers and SPV crewmembers was due to chance is less than 5 percent and thus statistically significant.
CFVs vs. ALL vessels Post-Accident drug tests
Figure 3 compares Post-Accident verified positives for one or more drugs between CFVs and ALL vessels with crewmembers subject to comprehensive chemical testing from 2003-2011. Recall from Figure 1 that Post-Accident drug test positivity rates of SPV crewmembers subject to chemical testing were much lower than drug test positivity rates of CFV crewmembers not otherwise subject to chemical testing. The differences were even greater when CFV crewmembers’ positivity rates are compared to crewmembers of ALL vessels with crewmembers subject to comprehensive chemical testing.
Post-Accident positivity rates of crewmembers subject to chemical testing from ALL vessels were at least 89% lower and as much as 97% lower than Post-Accident positivity rates of CFV crewmembers. Crewmembers from ALL vessels averaged 92% fewer Post-Accident positive drug tests than CFV crewmembers. Overall, the probability that Post-Accident drug test positivity rates between CFV crewmembers and ALL crewmembers was due to chance is much less than five percent and thus statistically significant.
CFV vs. SPV Post-Accident positive drug tests per SMI
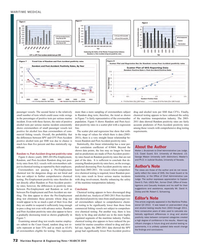
In response to whether chemical testing reduces the potential for marine casualties related to drug and alcohol use, Post-Accident positive drug tests wee compared to the yearly 2003-2011 SMIs in which drug tests are reported. Comparisons were performed in the same manner as those presented above except they are per-incident instead of per-person and include only SMIs in which drug tests are reported. As shown in Figure 4, SPV Post-Accident positive drug tests per SMI are much lower than CFV Post-Accident positive drug tests per SMI by at least 17% and as much as 93%. SPVs Post-Accident positive drug tests per SMI averaged 64% lower than CFV Post-Accident positive drug tests per SMI. Overall, the probability that the differences between SPV and CFV Post-Accident positive drug tests per SMI was due to chance is much less than five percent and thus statistically significant.
CFV vs. SPV Post-Accident alcohol tests per SMI
In further response to whether chemical testing reduces the potential for marine casualties related to drug and alcohol use, Post-Accident positive alcohol tests were compared to the yearly 2003-2011 SMIs in which alcohol tests were reported. As shown in Figure 5, SPV positive alcohol tests per SMI were much lower than CFV positive alcohol tests per SMI by at least 8% and as much as 100%. SPV Post-Accident positive alcohol tests per SMI averaged 73% lower than CFV Post-Accident positive alcohol tests per SMI.
As with year to year variations in alcohol test results in previous comparisons, similar variations exist here. Two factors are known to contribute to these variations. The first factor is the two hour time period in which alcohol tests must be ordered. This time limitation will leave out many instances in which tests ought to have been ordered but were not due to the remoteness of the vessel’s location, especially commercial fishing vessels that ordinarily operate farther offshore than small passenger vessels. The second factor is the relatively small number of tests which could cause wide swings in the percentages of positive tests per serious marine incident. Even with these factors, the ratio of positive alcohol tests per serious marine incident consistently shows crewmembers of small passenger vessels test positive for alcohol less than crewmembers of commercial fishing vessels. Overall, the probability that the differences between SPV and CFV Post-Accident positive alcohol tests per SMI was due to chance is much less than five percent and thus statistically significant.
Random vs. Post-Accident drug test positivity rates
Figure 6 shows yearly 2003-2011Pre-Employment, Random, and Post-Accident Random drug test positivity rates from ALL vessels with crewmembers subject to chemical testing as reported by their employers.
Trend Line of Random and Post-Accident positivity rates
Crewmembers not passing a Pre-Employment chemical test for dangerous drugs are not hired and thus not subject to further comprehensive chemical testing. Pre-Employment positivity rates therefore do not directly affect Random or Post-Accident positivity rates; however, the differences in positivity rates between Pre-Employment and Random as well as between Pre-Employment and Post-Accident are startling. The data appear to show the Pre-Employment drug test eliminates those persons whose drug use would appear to be so much a part of their lives that they are unable to suspend it sufficiently long enough to pass a drug test even with advance notice. Random and Post-Accident positivity rates also appear to have a gradually decreasing trend as shown graphically in Figure 7.
Scatter Plot and Regression line for Random versus Post-Accident positivity rates
Examining annual drug test results marine employers submit to the Coast Guard, random drug test results represent at least 53% and as much as 63.6% of crewmembers eligible for testing. This represents more than a mere sampling of crewmembers subject to Random drug tests; therefore, the trend as shown in Figure 7 is fairly representative of the crewmember population. Figure 8 shows Random and Post-Accident positivity rates in a scatter plot with a regression line.
The scatter plot and regression line show that within the range of values for which there is data (2003-2011), there is a very straight linear relationship between Random and Post-Accident positivity rates. Statistically, this linear relationship has a near perfect correlation coefficient of 0.9464. Beyond the shown data points, the line may no longer be linear and no predictions are made of Post-Accident positivity rates based on Random positivity rates that are not part of the data. It is sufficient to conclude that decreasing Random positivity rates have, on the average, predicted decreasing Post-Accident positivity rates at least from 2003-2011. On vessels where comprehensive chemical testing is required, lower Random positivity rates result in fewer serious marine incidents with drug involvement, thereby enhancing the safety of the maritime transportation industry.Conclusion
Chemical testing appears to have discouraged drug and alcohol use. Analysis of 2003-2011 Post-Accident data showed positivity rates from small passenger vessel crewmembers subject to comprehensive chemical testing to be significantly lower than those from commercial fishing vessels not subject to comprehensive chemical testing. Put another way, there is less likely to be drug and alcohol use in the more highly regulated segments of the maritime industry. Further, chemical testing also appears to have reduced the potential for marine casualties related to drug and alcohol use. Again, the 2003-2011 data showed the SPV group had significantly fewer Post-Accident positive drug and alcohol tests per SMI than CFVs. Finally, chemical testing appears to have enhanced the safety of the maritime transportation industry. The 2003-2011 data showed Random positivity rates are fairly accurate predictors of Post-Accident positivity rates among those vessels with comprehensive drug testing requirements.
NOTES:
This article is a summary of the dissertation submitted in partial fulfillment of requirements for a Ph.D. in Judicial Studies. Entitled Chemical Testing of Commercial Vessel Personnel: An Analysis of Archived Test Results, the views are those of the author and do not necessarily reflect the views of DHS, the Coast Guard or its leadership, or the Office of Chief Administrative Law Judge. The author expresses appreciation to Captain David S. Fish, Chief, Office of Investigations and Casualty Analysis and his staff for their suggestions and assistance, especially Mr. David H. Dickey and Mr. Robert C. Schoening. Mr. Dickey also served on the author’s dissertation committee as subject matter expert.
(As published in the 3Q edition of Maritime Professional - www.maritimeprofessional.com)
-
- A SUCCESSFUL MARITIME POLICY UNDER ATTACK Maritime Reporter, Jun 1985 #58
a draft report on shipping, shipbuilding, and sealift and is in reference to the Merchant Marine Act of 1936, which constitutes our current domestic maritime poli cy. This report was developed by a Presidentially-appointed federal advisory committee whose responsibility is to advise the President and the
-
- Mitigating Maritime Risk Maritime Reporter, Aug 2019 #26
to facilitate information sharing and can only be established with the cooperation of law enforcement, military forces and the international maritime transportation industry. The lack of modern and agile global and regional governance structures has generated friction between the globalized corporate
-
- Insights: Dennis L. Bryant, Bryant’s Maritime Consulting Marine News, Nov 2013 #12
tons or less. The study revealed that random testing not only reduces the potential for marine casualties, but also enhances the safety of the maritime transportation industry. Is there a particular reason why one sector of the domestic marine industry is left out of the testing schemes while others are not? The
-
- Opinion: Maritime Freedom & the Global Commons Maritime Reporter, Mar 2020 #72
only be established with the cooperation of military forces, national law enforcement agencies, and close cooperation with the international maritime transportation industry. Understanding Pattern of Life is critical to identifying abnormalities that may be indicators to hostile or subversive actions.The lack
-
- Security of Ports and Vessels: A New Approach Maritime Reporter, May 2004 #60
governments to issue "seafarer" identification cards that can be used to verify an individual's identity to all personnel involved in the maritime transportation industry. In similar fashion, the U.S. is finalizing plans for a prototype phase of the Transportation Worker Identification Credential (TWIC)
-
- To Litigate, or Arbitrate? That is the Question Maritime Reporter, May 2014 #24
to select the person(s) who will resolve the dispute. This is important because judges and juries are not likely to have expertise in the maritime transportation industry, and they may have no experience operating a business. This may not be important in some cases; but in others, technical competence will
-
 )
March 2020 - Maritime Reporter and Engineering News page: 74
)
March 2020 - Maritime Reporter and Engineering News page: 74loca- al law enforcement agencies, and close cooperation with the tion of one’s competitors. So as James Holmes so eloquently international maritime transportation industry. Understand- states, these clashes are not merely about the Strait of Hor- ing Pattern of Life is critical to identifying abnormalities
-
 )
March 2018 - Maritime Reporter and Engineering News page: 72
)
March 2018 - Maritime Reporter and Engineering News page: 72enhanced the safety in the percentages of positive tests per serious marine in Figure 7 is fairly representative of the crewmember of the maritime transportation industry. The 2003- incident. Even with these factors, the ratio of positive population. Figure 8 shows Random and Post-Acci- 2011 data showed
-
 )
May 2014 - Maritime Reporter and Engineering News page: 24
)
May 2014 - Maritime Reporter and Engineering News page: 24the person(s) who will resolve the dispute. This is important because judges and juries are not likely to have expertise in the maritime transportation industry, and they may have no experience operating a business. This may not be important in some cases; but in others, technical competence
-
 )
July 1970 - Maritime Reporter and Engineering News page: 8
)
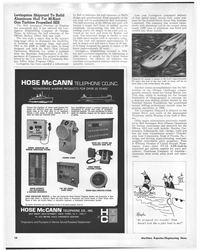
July 1970 - Maritime Reporter and Engineering News page: 8has had extensive experience in fabricating a wide variety of vessels for the United States Government, the offshore oil industry, the maritime transportation industry and for ocean- ographic research. Last year Levingston completed delivery of four patrol escort vessels built under con- tract for
-
 )
November 2013 - Marine News page: 16
)
November 2013 - Marine News page: 16of 100 tons or less. The study revealed that random testing not only reduces the potential for marine ca- sualties, but also enhances the safety of the maritime transportation industry. Is there a particular reason why one sector of the domestic marine industry is left out of the testing schemes while others
-
 )
October 2013 - Marine News page: 10
)
October 2013 - Marine News page: 10industry. BY THE NUMBERS , Chemical testing not only reduces the potential for marine casualties, but also enhances the safety of the maritime transportation industry. NOTES: The data depicted is a summary of the dissertation submitted in partial fulÞ llment of requirements for the Ph.D. in Judicial
-
 )
Q3 2013 - Maritime Logistics Professional page: 53
)
Q3 2013 - Maritime Logistics Professional page: 53Post-Accident positive drug and alcohol tests per SMI than CFVs. Finally, chemical testing ap- pears to have enhanced the safety of the maritime transportation industry. The 2003-2011 data showed Random posi- tivity rates are fairly accurate predictors of Post-Accident positivity rates among those vessels
-
 )
Q3 2013 - Maritime Logistics Professional page: 50
)
Q3 2013 - Maritime Logistics Professional page: 50by commercial ves- sel personnel, reduce the potential for marine casualties related to drug and alcohol use, and enhance the safety of the maritime transportation industry. While the Coast Guard has been collecting data on drug testing results for more than 20 years, there have not been any studies on the
-
 )
August 2, 2012 - Marine News page: 16
)
August 2, 2012 - Marine News page: 16of the land for good reason. It supports U.S. homeland security, national security and economic security. It helps ensure a robust domestic maritime transportation industry, critical to the efÞ cient ß ow of essential commerce. And, perhaps most importantly in this still troubled economy, it helps preserve
-
 )
August 2012 - Marine News page: 16
)
August 2012 - Marine News page: 16of the land for good reason. It supports U.S. homeland security, national security and economic security. It helps ensure a robust domestic maritime transportation industry, critical to the efÞ cient ß ow of essential commerce. And, perhaps most importantly in this still troubled economy, it helps preserve
-
 )
November 2009 - Maritime Reporter and Engineering News page: 74
)
November 2009 - Maritime Reporter and Engineering News page: 74business information management solution, both in the United States and Canada. Perduto has extensive business development experience in the maritime transportation industry, most recently as Vice President of Sales, Marketing and Customer Service for H?egh Autoliners Inc. in New York. In addition to his commercial
-
)
April 2007 - Maritime Reporter and Engineering News page: 62
MacGREGOR Group, member of Cargotec Corporation, is the global market leader in creating seamless engineering and service solutions for the maritime transportation industry, from the conceptual birth of a vessel to the end of its lifetime. Shipowners, ship operators and shipyards are our customers. The products
-
)
September 2006 - Maritime Reporter and Engineering News page: 78
Telenor Satellite Services' capabilities to deliver complete communications packages and services for the Oil & Offshore market as well as the maritime transportation industry. Norse Electronics will form part of the Customized Solutions business segment of Telenor Satellite Services, further strengthening the