
Page 74: of Marine Technology Magazine (March 2012)
Subsea Vehicle Report – Unmanned Underwater Systems
Read this page in Pdf, Flash or Html5 edition of March 2012 Marine Technology Magazine
 73
73
 75
75
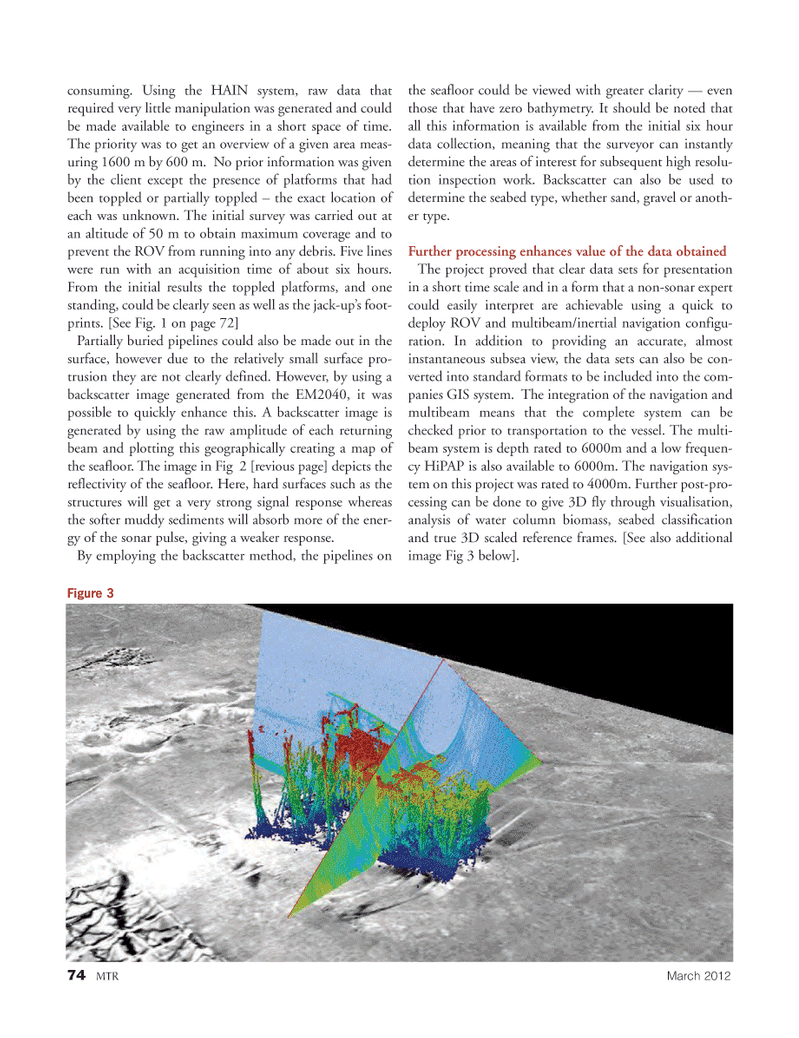
74MTRMarch 2012 consuming. Using the HAIN system, raw data that required very little manipulation was generated and could be made available to engineers in a short space of time. The priority was to get an overview of a given area meas- uring 1600 m by 600 m. No prior information was given by the client except the presence of platforms that had been toppled or partially toppled ? the exact location of each was unknown. The initial survey was carried out at an altitude of 50 m to obtain maximum coverage and to prevent the ROV from running into any debris. Five lines were run with an acquisition time of about six hours. From the initial results the toppled platforms, and one standing, could be clearly seen as well as the jack-up?s foot- prints. [See Fig. 1 on page 72] Partially buried pipelines could also be made out in the surface, however due to the relatively small surface pro- trusion they are not clearly defined. However, by using a backscatter image generated from the EM2040, it was possible to quickly enhance this. A backscatter image isgenerated by using the raw amplitude of each returning beam and plotting this geographically creating a map of the seafloor. The image in Fig 2 [revious page] depicts the reflectivity of the seafloor. Here, hard surfaces such as the structures will get a very strong signal response whereas the softer muddy sediments will absorb more of the ener- gy of the sonar pulse, giving a weaker response. By employing the backscatter method, the pipelines on the seafloor could be viewed with greater clarity ? even those that have zero bathymetry. It should be noted that all this information is available from the initial six hour data collection, meaning that the surveyor can instantly determine the areas of interest for subsequent high resolu- tion inspection work. Backscatter can also be used to determine the seabed type, whether sand, gravel or anoth- er type.Further processing enhances value of the data obtained The project proved that clear data sets for presentation in a short time scale and in a form that a non-sonar expert could easily interpret are achievable using a quick to deploy ROV and multibeam/inertial navigation configu- ration. In addition to providing an accurate, almost instantaneous subsea view, the data sets can also be con- verted into standard formats to be included into the com- panies GIS system. The integration of the navigation and multibeam means that the complete system can bechecked prior to transportation to the vessel. The multi- beam system is depth rated to 6000m and a low frequen- cy HiPAP is also available to 6000m. The navigation sys- tem on this project was rated to 4000m. Further post-pro- cessing can be done to give 3D fly through visualisation, analysis of water column biomass, seabed classificationand true 3D scaled reference frames. [See also additional image Fig 3 below]. Figure 3 MTR#2 (66-81):MTR Layouts 2/22/2012 10:14 AM Page 74