Page 38: of Marine Technology Magazine (November 2012)
Fresh Water Monitoring & Sensors
Read this page in Pdf, Flash or Html5 edition of November 2012 Marine Technology Magazine
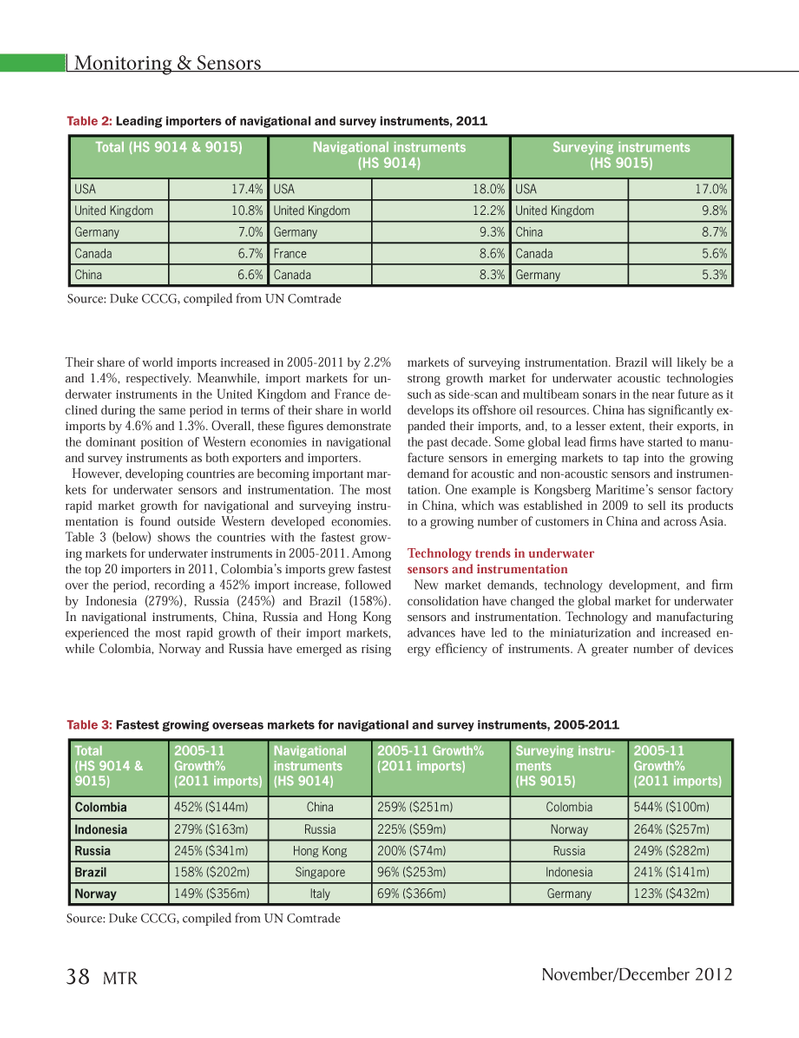
Their share of world imports increased in 2005-2011 by 2.2% and 1.4%, respectively. Meanwhile, import markets for un- derwater instruments in the United Kingdom and France de- clined during the same period in terms of their share in world imports by 4.6% and 1.3%. Overall, these Þ gures demonstrate the dominant position of Western economies in navigational and survey instruments as both exporters and importers. However, developing countries are becoming important mar- kets for underwater sensors and instrumentation. The most rapid market growth for navigational and surveying instru- mentation is found outside Western developed economies. Table 3 (below) shows the countries with the fastest grow- ing markets for underwater instruments in 2005-2011. Among the top 20 importers in 2011, ColombiaÕs imports grew fastest over the period, recording a 452% import increase, followed by Indonesia (279%), Russia (245%) and Brazil (158%). In navigational instruments, China, Russia and Hong Kong experienced the most rapid growth of their import markets, while Colombia, Norway and Russia have emerged as rising markets of surveying instrumentation. Brazil will likely be a strong growth market for underwater acoustic technologies such as side-scan and multibeam sonars in the near future as it develops its offshore oil resources. China has signiÞ cantly ex- panded their imports, and, to a lesser extent, their exports, in the past decade. Some global lead Þ rms have started to manu- facture sensors in emerging markets to tap into the growing demand for acoustic and non-acoustic sensors and instrumen-tation. One example is Kongsberg MaritimeÕs sensor factory in China, which was established in 2009 to sell its products to a growing number of customers in China and across Asia. Technology trends in underwater sensors and instrumentationNew market demands, technology development, and Þ rm consolidation have changed the global market for underwater sensors and instrumentation. Technology and manufacturing advances have led to the miniaturization and increased en- ergy efÞ ciency of instruments. A greater number of devices Monitoring & Sensors Total (HS 9014 & 9015) Navigational instruments(HS 9014)Surveying instruments (HS 9015)USA 17.4%USA 18.0%USA 17.0%United Kingdom10.8%United Kingdom 12.2%United Kingdom 9.8%Germany7.0%Germany 9.3%China 8.7%Canada6.7%France 8.6%Canada 5.6%China6.6%Canada 8.3%Germany 5.3%Total (HS 9014 & 9015)2005-11 Growth% (2011 imports) Navigational instruments(HS 9014)2005-11 Growth% (2011 imports) Surveying instru- ments(HS 9015)2005-11 Growth% (2011 imports) Colombia452% ($144m)China 259% ($251m)Colombia544% ($100m) Indonesia279% ($163m)Russia 225% ($59m)Norway264% ($257m) Russia245% ($341m)Hong Kong 200% ($74m)Russia249% ($282m) Brazil158% ($202m)Singapore96% ($253m)Indonesia241% ($141m) Norway 149% ($356m)Italy69% ($366m)Germany 123% ($432m) Source: Duke CCCG, compiled from UN Comtrade Source: Duke CCCG, compiled from UN Comtrade Table 2: Leading importers of navigational and survey instruments, 2011 Table 3: Fastest growing overseas markets for navigational and survey instruments, 2005-2011 November/December 201238 MTRMTR #9 (34-49).indd 38MTR #9 (34-49).indd 3811/29/2012 11:30:05 AM11/29/2012 11:30:05 AM

 37
37

 39
39
