
Page 44: of Marine Technology Magazine (June 2020)
Read this page in Pdf, Flash or Html5 edition of June 2020 Marine Technology Magazine
 43
43
 45
45
FEATURE Hydrographic Survey clouds, we can see that points have the as combining a medium resolution mesh laser points, such as the surrounding advantage of no additional building time, with a point cloud to help create struc- vegetation, are left as a point cloud, as compared to grids and meshes. As your ture, and occlude points on the backside direct analysis is not needed for those point density and resolution increases, of the point cloud. This improves the points. mesh construction can be resource inten- visual perception of the points, without sive. However a modern multi-core ma- needing the time to create a high resolu- Maximizing your Point Clouds chine can help offset this, with a close to tion mesh. A more complex example is There are signifcant costs associated linear reduction in build times with each when working with a large multi-sensor with collecting and processing dense, additional CPU core. Points naturally survey. This can be examined using a high-resolution point cloud data. To represent objects at the full resolution of sample data set from Bibby Hydromap, maximize the return on those costs, it is the sensor, with 3D meshes usually com- a former survey company based in the important to have a set of tools that can ing close to the same. UK. The asset inspection survey com- best leverage the investment in collect-
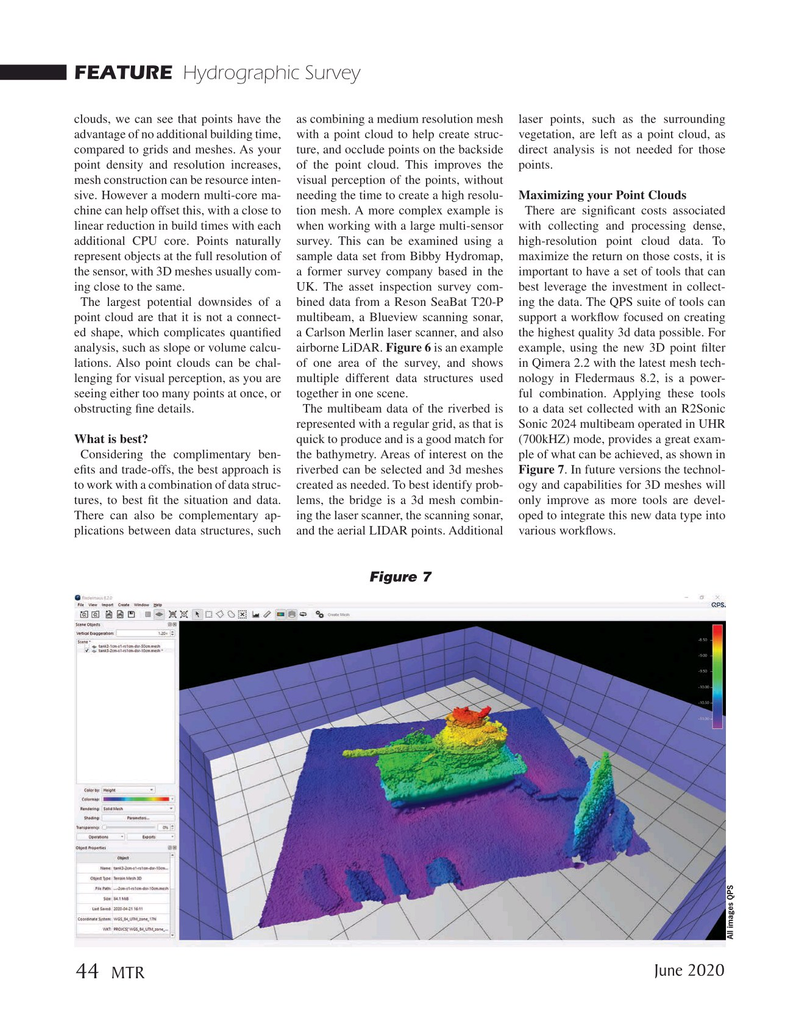
The largest potential downsides of a bined data from a Reson SeaBat T20-P ing the data. The QPS suite of tools can point cloud are that it is not a connect- multibeam, a Blueview scanning sonar, support a workfow focused on creating ed shape, which complicates quantifed a Carlson Merlin laser scanner, and also the highest quality 3d data possible. For analysis, such as slope or volume calcu- airborne LiDAR. Figure 6 is an example example, using the new 3D point flter lations. Also point clouds can be chal- of one area of the survey, and shows in Qimera 2.2 with the latest mesh tech- lenging for visual perception, as you are multiple different data structures used nology in Fledermaus 8.2, is a power- seeing either too many points at once, or together in one scene. ful combination. Applying these tools obstructing fne details. The multibeam data of the riverbed is to a data set collected with an R2Sonic represented with a regular grid, as that is Sonic 2024 multibeam operated in UHR
What is best? quick to produce and is a good match for (700kHZ) mode, provides a great exam-
Considering the complimentary ben- the bathymetry. Areas of interest on the ple of what can be achieved, as shown in efts and trade-offs, the best approach is riverbed can be selected and 3d meshes Figure 7. In future versions the technol- to work with a combination of data struc- created as needed. To best identify prob- ogy and capabilities for 3D meshes will tures, to best ft the situation and data. lems, the bridge is a 3d mesh combin- only improve as more tools are devel-
There can also be complementary ap- ing the laser scanner, the scanning sonar, oped to integrate this new data type into plications between data structures, such and the aerial LIDAR points. Additional various workfows.
Figure 7
All images QPS
June 2020 44
MTR