Page 31: of Marine Technology Magazine (November 2021)
Ocean Observation: Gliders, Buoys & Sub-Surface Networks
Read this page in Pdf, Flash or Html5 edition of November 2021 Marine Technology Magazine
East Coast Deployments Buoy Upgrades and Lidar Validation
In December 2014, one buoy was deployed 42 km off the Following their East Coast mission, the buoys were out? tted coast of Virginia, and in November 2015, the second buoy was with upgraded lidar systems that better capture wind data at deployed 5 km off the coast of New Jersey. Each buoy collect- extended heights above the sea surface, allowing for improved ed over a year’s worth of continuous metocean data, providing understanding of wind behavior at increasing hub heights and the ? rst open-ocean observations of hub height wind speed across the large rotor-swept area of offshore wind turbines. and direction over a full annual cycle in the United States. The buoys returned to Atlantic Ocean waters in 2019, this
The buoys diligently collected data during conditions that are time off the coast of Martha’s Vineyard, Massachusetts to vali- experienced by East Coast offshore wind farms, ranging from date the new lidar systems using the observational technology gentle winds and seas to hurricanes and nor’easters. available at Woods Hole Oceanographic Institute.
Observations from the East Coast buoy deployments pro- Validating the readings from the lidar buoys through an off- pelled offshore wind energy research in a variety of impact- shore measurement campaign helps evaluate the accuracy ful directions. First, researchers thoroughly characterized and and uncertainty of the subsequent wind resource measure- examined the wind resource at the two locations of offshore ments. The validation process involves deploying each lidar wind energy development according to seasonal and diurnal buoy near a trusted reference source for comparison. The lidar trends, origin of the wind resource, and an assortment of met- must collect measurements across a range of wind conditions, ocean conditions such as atmospheric stability and wave age. including low- and high-wind speeds, that can be evaluated
Once researchers established the behavior of the wind re- against the reference source. A typical validation process can source off Virginia and New Jersey, they employed the buoy take between four and eight weeks to capture enough mea- observations to validate theoretical wind speed pro? le as- surements across the required wind speed range. Guidelines sumptions, such as the logarithmic wind pro? le from Monin- for validating the performance of ? oating lidar systems have
Obukhov Similarity Theory, and reanalysis models that in- been published by the Carbon Trust, including their Roadmap corporate them. Reanalysis models are commonly engaged in for Commercial Acceptance of Floating Lidar Technology and setting wind energy project performance expectations, and the a set of Recommended Practices for Floating Lidar Systems,
East Coast buoy observations revealed a slow wind speed bias which was later published by the International Energy Agency in these models, which translated to simulated gross capacity Wind Technology Collaboration Program.
factors up to nine percentage points lower than the capacity factors suggested by the observations. These ? ndings inspired West Coast Deployments further research into potential improvements in wind resource After a successful validation campaign, the buoys were de- simulations through high-resolution models with coupled at- ployed in September and October 2020 off the northern and mospheric and oceanic feedback. central California coasts to support gathering metocean mea-
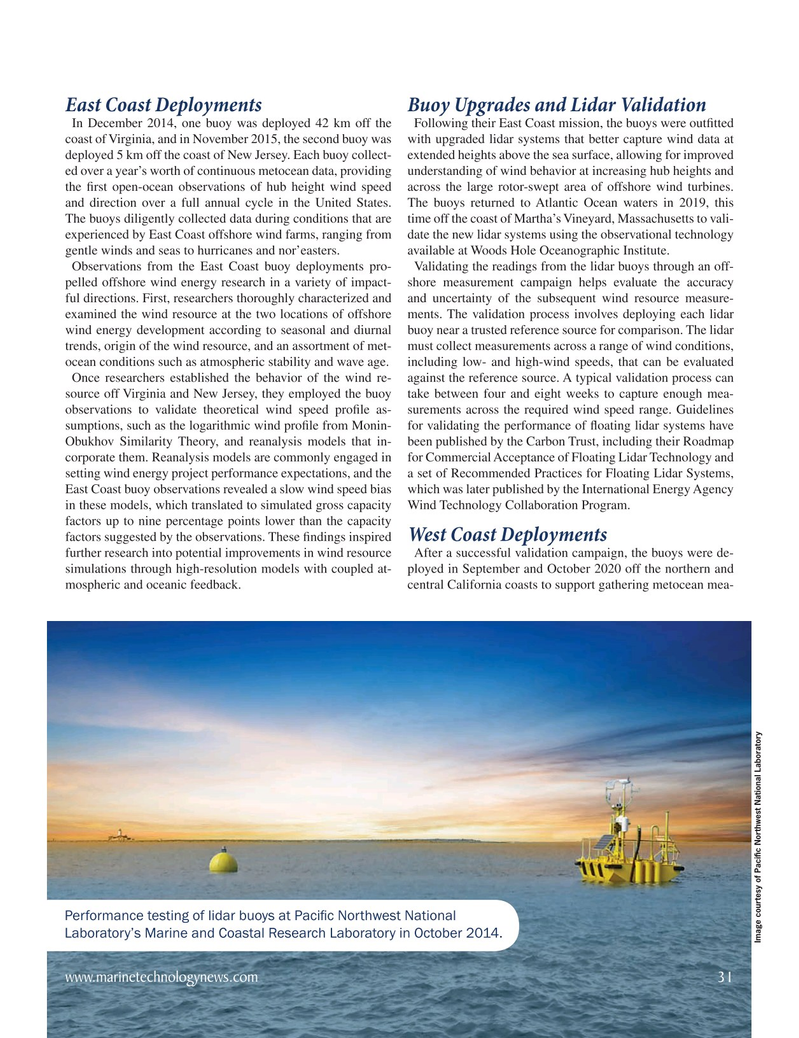
Performance testing of lidar buoys at Paci? c Northwest National
Laboratory’s Marine and Coastal Research Laboratory in October 2014.
Image courtesy of Paci? c Northwest National Laboratory www.marinetechnologynews.com 31
MTR #8 (18-33).indd 31 11/22/2021 12:40:01 PM

 30
30

 32
32
