
Page 74: of Marine Technology Magazine (Sep/Oct 2025)
Read this page in Pdf, Flash or Html5 edition of Sep/Oct 2025 Marine Technology Magazine
 73
73
 75
75
Lander Lab
MTR 100
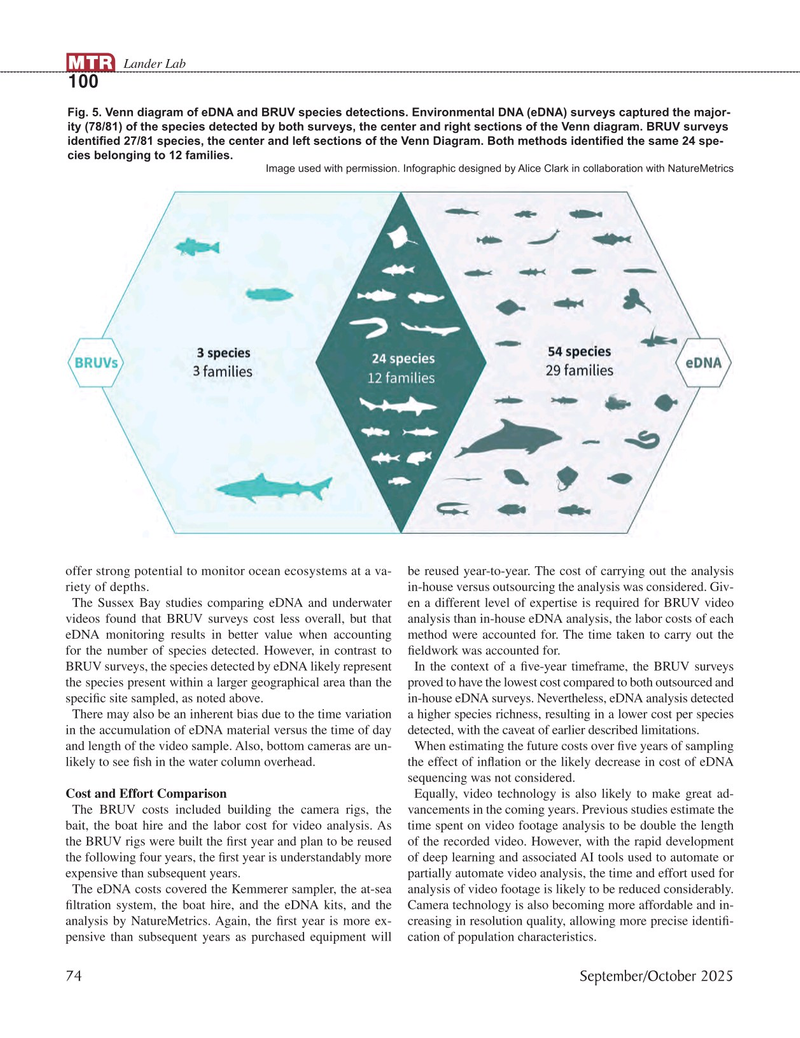
Fig. 5. Venn diagram of eDNA and BRUV species detections. Environmental DNA (eDNA) surveys captured the major- ity (78/81) of the species detected by both surveys, the center and right sections of the Venn diagram. BRUV surveys identi? ed 27/81 species, the center and left sections of the Venn Diagram. Both methods identi? ed the same 24 spe- cies belonging to 12 families.
Image used with permission. Infographic designed by Alice Clark in collaboration with NatureMetrics offer strong potential to monitor ocean ecosystems at a va- be reused year-to-year. The cost of carrying out the analysis riety of depths. in-house versus outsourcing the analysis was considered. Giv-
The Sussex Bay studies comparing eDNA and underwater en a different level of expertise is required for BRUV video videos found that BRUV surveys cost less overall, but that analysis than in-house eDNA analysis, the labor costs of each eDNA monitoring results in better value when accounting method were accounted for. The time taken to carry out the for the number of species detected. However, in contrast to ? eldwork was accounted for.
BRUV surveys, the species detected by eDNA likely represent In the context of a ? ve-year timeframe, the BRUV surveys the species present within a larger geographical area than the proved to have the lowest cost compared to both outsourced and speci? c site sampled, as noted above. in-house eDNA surveys. Nevertheless, eDNA analysis detected
There may also be an inherent bias due to the time variation a higher species richness, resulting in a lower cost per species in the accumulation of eDNA material versus the time of day detected, with the caveat of earlier described limitations.
and length of the video sample. Also, bottom cameras are un- When estimating the future costs over ? ve years of sampling likely to see ? sh in the water column overhead. the effect of in? ation or the likely decrease in cost of eDNA sequencing was not considered.
Cost and Effort Comparison Equally, video technology is also likely to make great ad-
The BRUV costs included building the camera rigs, the vancements in the coming years. Previous studies estimate the bait, the boat hire and the labor cost for video analysis. As time spent on video footage analysis to be double the length the BRUV rigs were built the ? rst year and plan to be reused of the recorded video. However, with the rapid development the following four years, the ? rst year is understandably more of deep learning and associated AI tools used to automate or expensive than subsequent years. partially automate video analysis, the time and effort used for
The eDNA costs covered the Kemmerer sampler, the at-sea analysis of video footage is likely to be reduced considerably. ? ltration system, the boat hire, and the eDNA kits, and the Camera technology is also becoming more affordable and in- analysis by NatureMetrics. Again, the ? rst year is more ex- creasing in resolution quality, allowing more precise identi? - pensive than subsequent years as purchased equipment will cation of population characteristics.
74 September/October 2025
MTR #7 (66-79).indd 74 MTR #7 (66-79).indd 74 10/8/2025 3:53:09 PM10/8/2025 3:53:09 PM