
Page 52: of Maritime Logistics Professional Magazine (Q2 2011)
Energy Transportation
Read this page in Pdf, Flash or Html5 edition of Q2 2011 Maritime Logistics Professional Magazine
 51
51
 53
53
52 Maritime Professional 2Q 2011 nario of not if, but “when” the first real- ly big environmental disaster will strike in the Arctic.
SPILL RESPONSE:
REALITIES & CHALLENGES
How much do we really have to worry about? Dagmar Schmidt Etkin of
Environmental Research Consulting, in her report entitled 40-Year Analysis of
US Oil Spillage Rates, says, “Forty years after the 1969 Santa Barbara,
California, well blowout that was a major impetus for the US environmen- tal movement, and twenty years after the 1989 Exxon Valdez spill, which spurred regulatory changes and industry initiatives to prevent oil spills, a com- prehensive analysis of US spillage rates shows significant progress in reducing spills.” In the wake of that report, she also acknowledges the now-infamous
Deepwater Horizon spill skews the data.
She adds, “You'd need to add in another 4.9 million barrels of oil, though that is just a guess right now.”
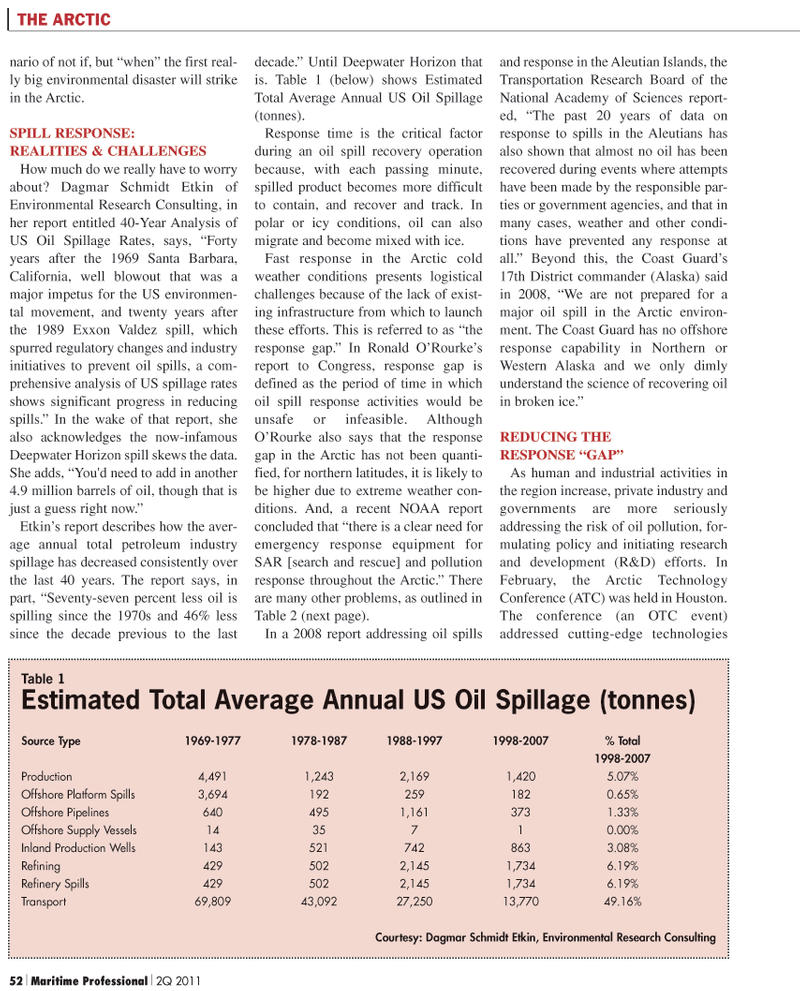
Etkin’s report describes how the aver- age annual total petroleum industry spillage has decreased consistently over the last 40 years. The report says, in part, “Seventy-seven percent less oil is spilling since the 1970s and 46% less since the decade previous to the last decade.” Until Deepwater Horizon that is. Table 1 (below) shows Estimated
Total Average Annual US Oil Spillage (tonnes).
Response time is the critical factor during an oil spill recovery operation because, with each passing minute, spilled product becomes more difficult to contain, and recover and track. In polar or icy conditions, oil can also migrate and become mixed with ice.
Fast response in the Arctic cold weather conditions presents logistical challenges because of the lack of exist- ing infrastructure from which to launch these efforts. This is referred to as “the response gap.” In Ronald O’Rourke’s report to Congress, response gap is defined as the period of time in which oil spill response activities would be unsafe or infeasible. Although
O’Rourke also says that the response gap in the Arctic has not been quanti- fied, for northern latitudes, it is likely to be higher due to extreme weather con- ditions. And, a recent NOAA report concluded that “there is a clear need for emergency response equipment for
SAR [search and rescue] and pollution response throughout the Arctic.” There are many other problems, as outlined in
Table 2 (next page).
In a 2008 report addressing oil spills and response in the Aleutian Islands, the
Transportation Research Board of the
National Academy of Sciences report- ed, “The past 20 years of data on response to spills in the Aleutians has also shown that almost no oil has been recovered during events where attempts have been made by the responsible par- ties or government agencies, and that in many cases, weather and other condi- tions have prevented any response at all.” Beyond this, the Coast Guard’s 17th District commander (Alaska) said in 2008, “We are not prepared for a major oil spill in the Arctic environ- ment. The Coast Guard has no offshore response capability in Northern or
Western Alaska and we only dimly understand the science of recovering oil in broken ice.”
REDUCING THE
RESPONSE “GAP”
As human and industrial activities in the region increase, private industry and governments are more seriously addressing the risk of oil pollution, for- mulating policy and initiating research and development (R&D) efforts. In
February, the Arctic Technology
Conference (ATC) was held in Houston.
The conference (an OTC event) addressed cutting-edge technologies
THE ARCTIC
Table 1
Estimated Total Average Annual US Oil Spillage (tonnes)
Source Type 1969-1977 1978-1987 1988-1997 1998-2007 % Total 1998-2007
Production 4,491 1,243 2,169 1,420 5.07%
Offshore Platform Spills 3,694 192 259 182 0.65%
Offshore Pipelines 640 495 1,161 373 1.33%
Offshore Supply Vessels 14 35 7 1 0.00%
Inland Production Wells 143 521 742 863 3.08%
Refining 429 502 2,145 1,734 6.19%
Refinery Spills 429 502 2,145 1,734 6.19%
Transport 69,809 43,092 27,250 13,770 49.16%
Courtesy: Dagmar Schmidt Etkin, Environmental Research Consulting