Page 56: of Maritime Logistics Professional Magazine (Q2 2011)
Energy Transportation
Read this page in Pdf, Flash or Html5 edition of Q2 2011 Maritime Logistics Professional Magazine
 55
55
 57
57
56 Maritime Professional 2Q 2011
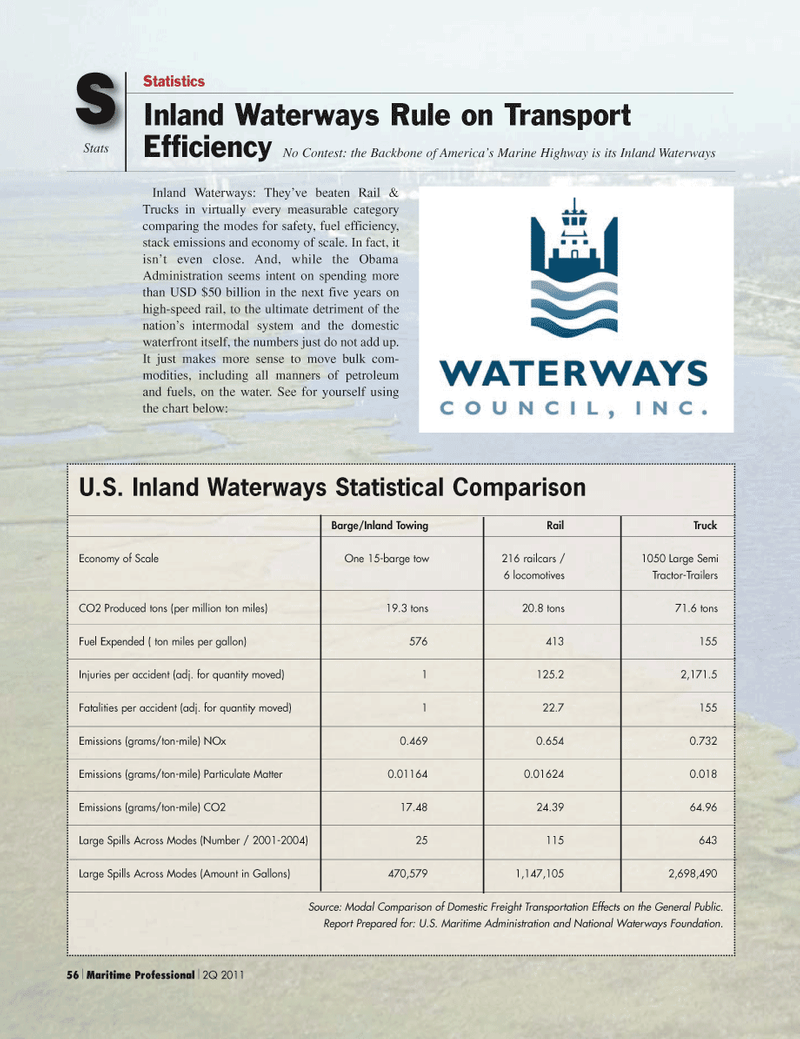
Inland Waterways: They’ve beaten Rail &
Trucks in virtually every measurable category comparing the modes for safety, fuel efficiency, stack emissions and economy of scale. In fact, it isn’t even close. And, while the Obama
Administration seems intent on spending more than USD $50 billion in the next five years on high-speed rail, to the ultimate detriment of the nation’s intermodal system and the domestic waterfront itself, the numbers just do not add up.
It just makes more sense to move bulk com- modities, including all manners of petroleum and fuels, on the water. See for yourself using the chart below:
S
Stats
Inland Waterways Rule on Transport
Efficiency No Contest: the Backbone of America’s Marine Highway is its Inland Waterways
Statistics
U.S. Inland Waterways Statistical Comparison
Barge/Inland Towing Rail Truck
Economy of Scale One 15-barge tow 216 railcars / 1050 Large Semi 6 locomotives Tractor-Trailers
CO2 Produced tons (per million ton miles) 19.3 tons 20.8 tons 71.6 tons
Fuel Expended ( ton miles per gallon) 576 413 155
Injuries per accident (adj. for quantity moved) 1 125.2 2,171.5
Fatalities per accident (adj. for quantity moved) 1 22.7 155
Emissions (grams/ton-mile) NOx 0.469 0.654 0.732
Emissions (grams/ton-mile) Particulate Matter 0.01164 0.01624 0.018
Emissions (grams/ton-mile) CO2 17.48 24.39 64.96
Large Spills Across Modes (Number / 2001-2004) 25 115 643
Large Spills Across Modes (Amount in Gallons) 470,579 1,147,105 2,698,490
Source: Modal Comparison of Domestic Freight Transportation Effects on the General Public.
Report Prepared for: U.S. Maritime Administration and National Waterways Foundation.