
Page 62: of Maritime Logistics Professional Magazine (Q2 2012)
Maritime Risk
Read this page in Pdf, Flash or Html5 edition of Q2 2012 Maritime Logistics Professional Magazine
 61
61
 63
63
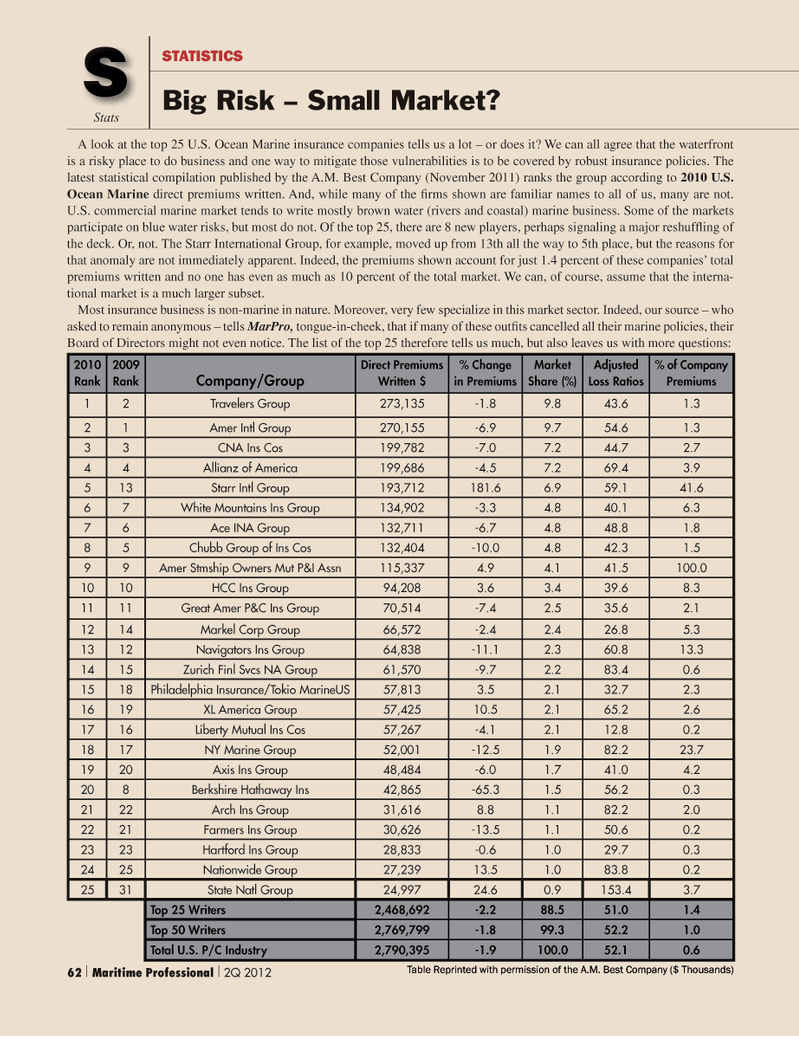
A look at the top 25 U.S. Ocean Marine insurance companies tells us a lot – or does it? We can all agree that the waterfront is a risky place to do business and one way to mitigate those vulnerabilities is to be covered by robust insurance policies. The latest statistical compilation published by the A.M. Best Company (November 2011) ranks the group according to 2010 U.S.
Ocean Marine direct premiums written. And, while many of the fi rms shown are familiar names to all of us, many are not.
U.S. commercial marine market tends to write mostly brown water (rivers and coastal) marine business. Some of the markets participate on blue water risks, but most do not. Of the top 25, there are 8 new players, perhaps signaling a major reshuffl ing of the deck. Or, not. The Starr International Group, for example, moved up from 13th all the way to 5th place, but the reasons for that anomaly are not immediately apparent. Indeed, the premiums shown account for just 1.4 percent of these companies’ total premiums written and no one has even as much as 10 percent of the total market. We can, of course, assume that the interna- tional market is a much larger subset.
Most insurance business is non-marine in nature. Moreover, very few specialize in this market sector. Indeed, our source – who asked to remain anonymous – tells MarPro, tongue-in-cheek, that if many of these outfi ts cancelled all their marine policies, their
Board of Directors might not even notice. The list of the top 25 therefore tells us much, but also leaves us with more questions: 2010
Rank 2009
Rank Company/Group
Direct Premiums
Written $ % Change in Premiums
Market
Share (%)
Adjusted
Loss Ratios % of Company
Premiums 1 2 Travelers Group 273,135 -1.8 9.8 43.6 1.3 2 1 Amer Intl Group 270,155 -6.9 9.7 54.6 1.3 3 3 CNA Ins Cos 199,782 -7.0 7.2 44.7 2.7 4 4 Allianz of America 199,686 -4.5 7.2 69.4 3.9 5 13 Starr Intl Group 193,712 181.6 6.9 59.1 41.6 6 7 White Mountains Ins Group 134,902 -3.3 4.8 40.1 6.3 7 6 Ace INA Group 132,711 -6.7 4.8 48.8 1.8 8 5 Chubb Group of Ins Cos 132,404 -10.0 4.8 42.3 1.5 9 9 Amer Stmship Owners Mut P&I Assn 115,337 4.9 4.1 41.5 100.0 10 10 HCC Ins Group 94,208 3.6 3.4 39.6 8.3 11 11 Great Amer P&C Ins Group 70,514 -7.4 2.5 35.6 2.1 12 14 Markel Corp Group 66,572 -2.4 2.4 26.8 5.3 13 12 Navigators Ins Group 64,838 -11.1 2.3 60.8 13.3 14 15 Zurich Finl Svcs NA Group 61,570 -9.7 2.2 83.4 0.6 15 18 Philadelphia Insurance/Tokio MarineUS 57,813 3.5 2.1 32.7 2.3 16 19 XL America Group 57,425 10.5 2.1 65.2 2.6 17 16 Liberty Mutual Ins Cos 57,267 -4.1 2.1 12.8 0.2 18 17 NY Marine Group 52,001 -12.5 1.9 82.2 23.7 19 20 Axis Ins Group 48,484 -6.0 1.7 41.0 4.2 20 8 Berkshire Hathaway Ins 42,865 -65.3 1.5 56.2 0.3 21 22 Arch Ins Group 31,616 8.8 1.1 82.2 2.0 22 21 Farmers Ins Group 30,626 -13.5 1.1 50.6 0.2 23 23 Hartford Ins Group 28,833 -0.6 1.0 29.7 0.3 24 25 Nationwide Group 27,239 13.5 1.0 83.8 0.2 25 31 State Natl Group 24,997 24.6 0.9 153.4 3.7
Top 25 Writers 2,468,692 -2.2 88.5 51.0 1.4
Top 50 Writers 2,769,799 -1.8 99.3 52.2 1.0
Total U.S. P/C Industry 2,790,395 -1.9 100.0 52.1 0.6
Stats
STATISTICS
Big Risk – Small Market?
S
Table Reprinted with permission of the A.M. Best Company ($ Thousands) 62 | Maritime Professional | 2Q 2012
MP #2 50-64 NEW STYLES.indd 62 5/4/2012 6:35:11 PM