
Page 51: of Maritime Logistics Professional Magazine (Q3 2013)
Training & Security
Read this page in Pdf, Flash or Html5 edition of Q3 2013 Maritime Logistics Professional Magazine
 50
50
 52
52
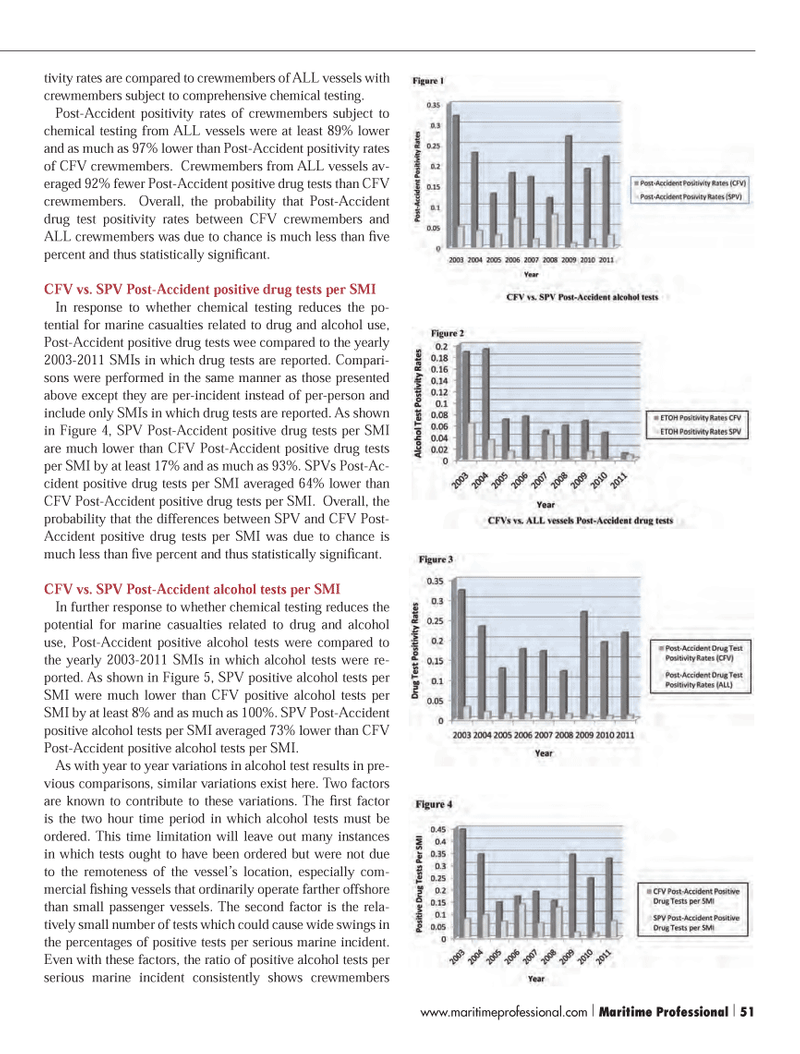
tivity rates are compared to crewmembers of ALL vessels with crewmembers subject to comprehensive chemical testing. Post-Accident positivity rates of crewmembers subject to chemical testing from ALL vessels were at least 89% lower and as much as 97% lower than Post-Accident positivity rates of CFV crewmembers. Crewmembers from ALL vessels av- eraged 92% fewer Post-Accident positive drug tests than CFV crewmembers. Overall, the probability that Post-Accident drug test positivity rates between CFV crewmembers and ALL crewmembers was due to chance is much less than Þ ve percent and thus statistically signiÞ cant. CFV vs. SPV Post-Accident positive drug tests per SMI In response to whether chemical testing reduces the po-tential for marine casualties related to drug and alcohol use, Post-Accident positive drug tests wee compared to the yearly 2003-2011 SMIs in which drug tests are reported. Compari-sons were performed in the same manner as those presented above except they are per-incident instead of per-person and include only SMIs in which drug tests are reported. As shown in Figure 4, SPV Post-Accident positive drug tests per SMI are much lower than CFV Post-Accident positive drug tests per SMI by at least 17% and as much as 93%. SPVs Post-Ac-cident positive drug tests per SMI averaged 64% lower than CFV Post-Accident positive drug tests per SMI. Overall, the probability that the differences between SPV and CFV Post- Accident positive drug tests per SMI was due to chance is much less than Þ ve percent and thus statistically signiÞ cant. CFV vs. SPV Post-Accident alcohol tests per SMI In further response to whether chemical testing reduces the potential for marine casualties related to drug and alcohol use, Post-Accident positive alcohol tests were compared to the yearly 2003-2011 SMIs in which alcohol tests were re-ported. As shown in Figure 5, SPV positive alcohol tests per SMI were much lower than CFV positive alcohol tests per SMI by at least 8% and as much as 100%. SPV Post-Accident positive alcohol tests per SMI averaged 73% lower than CFV Post-Accident positive alcohol tests per SMI. As with year to year variations in alcohol test results in pre- vious comparisons, similar variations exist here. Two factors are known to contribute to these variations. The Þ rst factor is the two hour time period in which alcohol tests must be ordered. This time limitation will leave out many instances in which tests ought to have been ordered but were not due to the remoteness of the vesselÕs location, especially com- mercial Þ shing vessels that ordinarily operate farther offshore than small passenger vessels. The second factor is the rela- tively small number of tests which could cause wide swings in the percentages of positive tests per serious marine incident. Even with these factors, the ratio of positive alcohol tests per serious marine incident consistently shows crewmembers www.maritimeprofessional.com | Maritime Professional | 51MP #3 50-63.indd 51MP #3 50-63.indd 519/10/2013 12:03:46 PM9/10/2013 12:03:46 PM