
Page 35: of Maritime Logistics Professional Magazine (Sep/Oct 2017)
CONTAINER PORTS
Read this page in Pdf, Flash or Html5 edition of Sep/Oct 2017 Maritime Logistics Professional Magazine
 34
34
 36
36
STATISTICS
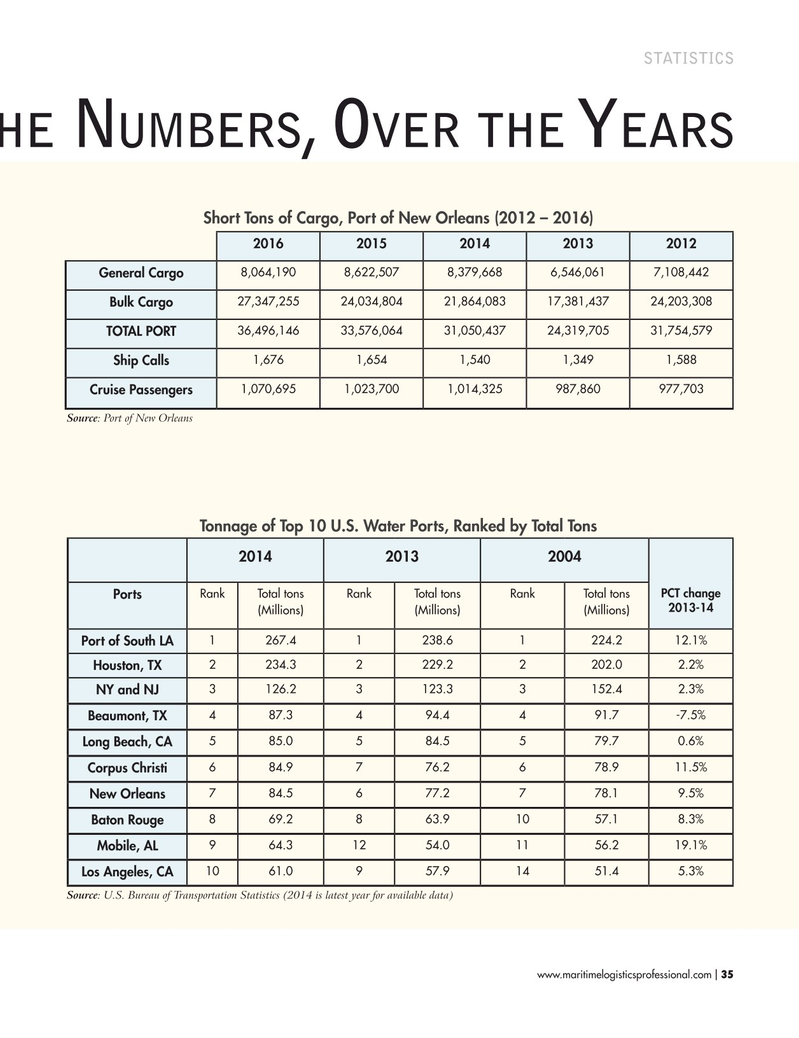
NOLA P t … B N , O yOrt rAffic y the umBers ver the eArs
Short Tons of Cargo, Port of New Orleans (2012 – 2016) 2016 2015 2014 2013 2012 8,064,190 8,622,507 8,379,668 6,546,061 7,108,442
General Cargo 27,347,255 24,034,804 21,864,083 17,381,437 24,203,308
Bulk Cargo 36,496,146 33,576,064 31,050,437 24,319,705 31,754,579
TOTAL PORT 1,676 1,654 1,540 1,349 1,588
Ship Calls 1,070,695 1,023,700 1,014,325 987,860 977,703
Cruise Passengers
Source: Port of New Orleans
Tonnage of Top 10 U.S. Water Ports, Ranked by Total Tons 2014 2013 2004
Rank Total tons Rank Total tons Rank Total tons PCT change
Ports 2013-14 (Millions) (Millions) (Millions) 1 267.4 1 238.6 1 224.2 12.1%
Port of South LA 2 234.3 2 229.2 2 202.0 2.2%
Houston, TX 3 126.2 3 123.3 3 152.4 2.3%
NY and NJ 4 87.3 4 94.4 4 91.7 -7.5%
Beaumont, TX 5 85.0 5 84.5 5 79.7 0.6%
Long Beach, CA 6 84.9 7 76.2 6 78.9 11.5%
Corpus Christi 7 84.5 6 77.2 7 78.1 9.5%
New Orleans 8 69.2 8 63.9 10 57.1 8.3%
Baton Rouge 9 64.3 12 54.0 11 56.2 19.1%
Mobile, AL 10 61.0 9 57.9 14 51.4 5.3%
Los Angeles, CA
Source: U.S. Bureau of Transportation Statistics (2014 is latest year for available data) www.maritimelogisticsprofessional.com 35
I