Page 49: of Maritime Logistics Professional Magazine (Nov/Dec 2019)
Short Sea Shipping Ports
Read this page in Pdf, Flash or Html5 edition of Nov/Dec 2019 Maritime Logistics Professional Magazine
m c c o w n
Tells a Story between China and the U.S. containers that arrive via the West
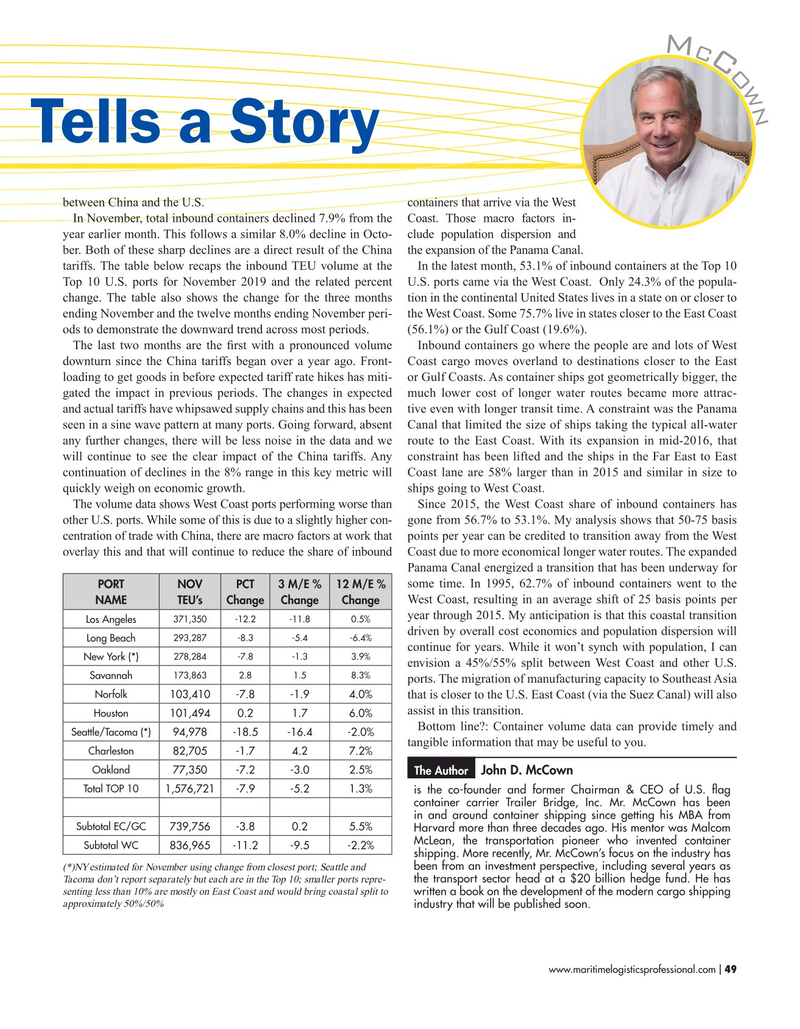
In November, total inbound containers declined 7.9% from the Coast. Those macro factors in- year earlier month. This follows a similar 8.0% decline in Octo- clude population dispersion and ber. Both of these sharp declines are a direct result of the China the expansion of the Panama Canal.
tariffs. The table below recaps the inbound TEU volume at the In the latest month, 53.1% of inbound containers at the Top 10
Top 10 U.S. ports for November 2019 and the related percent U.S. ports came via the West Coast. Only 24.3% of the popula- change. The table also shows the change for the three months tion in the continental United States lives in a state on or closer to ending November and the twelve months ending November peri- the West Coast. Some 75.7% live in states closer to the East Coast ods to demonstrate the downward trend across most periods. (56.1%) or the Gulf Coast (19.6%).
The last two months are the frst with a pronounced volume Inbound containers go where the people are and lots of West downturn since the China tariffs began over a year ago. Front- Coast cargo moves overland to destinations closer to the East loading to get goods in before expected tariff rate hikes has miti- or Gulf Coasts. As container ships got geometrically bigger, the gated the impact in previous periods. The changes in expected much lower cost of longer water routes became more attrac- and actual tariffs have whipsawed supply chains and this has been tive even with longer transit time. A constraint was the Panama seen in a sine wave pattern at many ports. Going forward, absent Canal that limited the size of ships taking the typical all-water any further changes, there will be less noise in the data and we route to the East Coast. With its expansion in mid-2016, that will continue to see the clear impact of the China tariffs. Any constraint has been lifted and the ships in the Far East to East continuation of declines in the 8% range in this key metric will Coast lane are 58% larger than in 2015 and similar in size to quickly weigh on economic growth. ships going to West Coast.
The volume data shows West Coast ports performing worse than Since 2015, the West Coast share of inbound containers has other U.S. ports. While some of this is due to a slightly higher con- gone from 56.7% to 53.1%. My analysis shows that 50-75 basis centration of trade with China, there are macro factors at work that points per year can be credited to transition away from the West overlay this and that will continue to reduce the share of inbound Coast due to more economical longer water routes. The expanded
Panama Canal energized a transition that has been underway for some time. In 1995, 62.7% of inbound containers went to the
PORT NOV PCT 3 M/E % 12 M/E %
West Coast, resulting in an average shift of 25 basis points per
NAME TEU’s Change Change Change year through 2015. My anticipation is that this coastal transition 371,350 -12.2 -11.8 0.5%
Los Angeles driven by overall cost economics and population dispersion will 293,287 -8.3 -5.4 -6.4%
Long Beach continue for years. While it won’t synch with population, I can 278,284 -7.8 -1.3 3.9%
New York (*) envision a 45%/55% split between West Coast and other U.S. 173,863 2.8 1.5 8.3%
Savannah ports. The migration of manufacturing capacity to Southeast Asia
Norfolk 103,410 -7.8 -1.9 4.0% that is closer to the U.S. East Coast (via the Suez Canal) will also assist in this transition.
Houston 101,494 0.2 1.7 6.0%
Bottom line?: Container volume data can provide timely and
Seattle/Tacoma (*) 94,978 -18.5 -16.4 -2.0% tangible information that may be useful to you.
Charleston 82,705 -1.7 4.2 7.2%
Oakland 77,350 -7.2 -3.0 2.5%
John D. McCown
The Author
Total TOP 10 1,576,721 -7.9 -5.2 1.3% is the co-founder and former Chairman & CEO of U.S. fag container carrier Trailer Bridge, Inc. Mr. McCown has been in and around container shipping since getting his MBA from
Subtotal EC/GC 739,756 -3.8 0.2 5.5%
Harvard more than three decades ago. His mentor was Malcom
McLean, the transportation pioneer who invented container
Subtotal WC 836,965 -11.2 -9.5 -2.2% shipping. More recently, Mr. McCown’s focus on the industry has been from an investment perspective, including several years as (*)NY estimated for November using change from closest port; Seattle and the transport sector head at a $20 billion hedge fund. He has
Tacoma don’t report separately but each are in the Top 10; smaller ports repre- senting less than 10% are mostly on East Coast and would bring coastal split to written a book on the development of the modern cargo shipping approximately 50%/50% industry that will be published soon.
www.maritimelogisticsprofessional.com 49
I

 48
48

 50
50
