
Page 14: of Maritime Reporter Magazine (February 1974)
Read this page in Pdf, Flash or Html5 edition of February 1974 Maritime Reporter Magazine
 13
13
 15
15
Esso Norway Tests— (Continued from page 14)
Structural response caused by pressure sys- tems on tank boundaries must be compared to a condition with zero pressure on tank boundaries in order to get absolute values. This meant that, under conditions of zero trim, the internal pressures on the boundaries of tank groups Nos. 2, 3, and 4 (except for the forward boundary of No. 2 and the after boundary of
No. 4) must be matched by the external pres-
sures governed by the draft. Expressed other-
wise, this meant that the height of water bal-
last in all tanks in groups Because this combination of drafts and tank
loadings formed the base with which all read-
ings of instruments were compared, this con-
dition was called a "base run."
Ideally, if the structure were affected only
by pressures, only one base run would be
needed. In reality, however, there are a num-
ber of other influences which affect the in-
strument readings which measure structural
response. Some of these are:
1. Thermal Influence. The phenomenon of
thermal stress is well-known, and the fact that
it is powerfully affected by radiation from the
sky had to be considered in planning the
test program. Time limitations led to the de-
cision to operate the test schedule on a con-
tinuous round-the-clock basis, without regard
to the ambient weather conditions at the time
of the instrument reading. In addition to the
temperature effects on the steel of the struc-
ture, temperature obviously has some effect
on the cabling of the instrumentation system
itself.
2. Instrument Drift. Instrument systems
normally show some drift, that is. continuous
change with time, even with the best com-
pensation available. Thus, in comparing the
readings of a test run with those of a base run,
the shorter the time interval separating the
two runs, the more reliable the results should
be.
3. Shakedown. The structure itself in some
areas is subject to sequential instabilities,
often characterized by the words snap-througii
or oil-canning. This means that a nominally
plane plate may exhibit a bulge to one side
at one time, and at another time under exactly
the same conditions of loading may exhibit a
bulge of another character, usually on the oth-
er side. Phenomena such as this characterize
structural "shakedown" and may be presumed
to gradually disappear as the structure under-
goes a series of loadings and unloadings and
finally assumes its ultimate form.
These three influences and some others less
important led to the decision to intersperse
among the sequence of test runs a number of
base runs instead of depending on a single
base run.
Strain Gage Locations
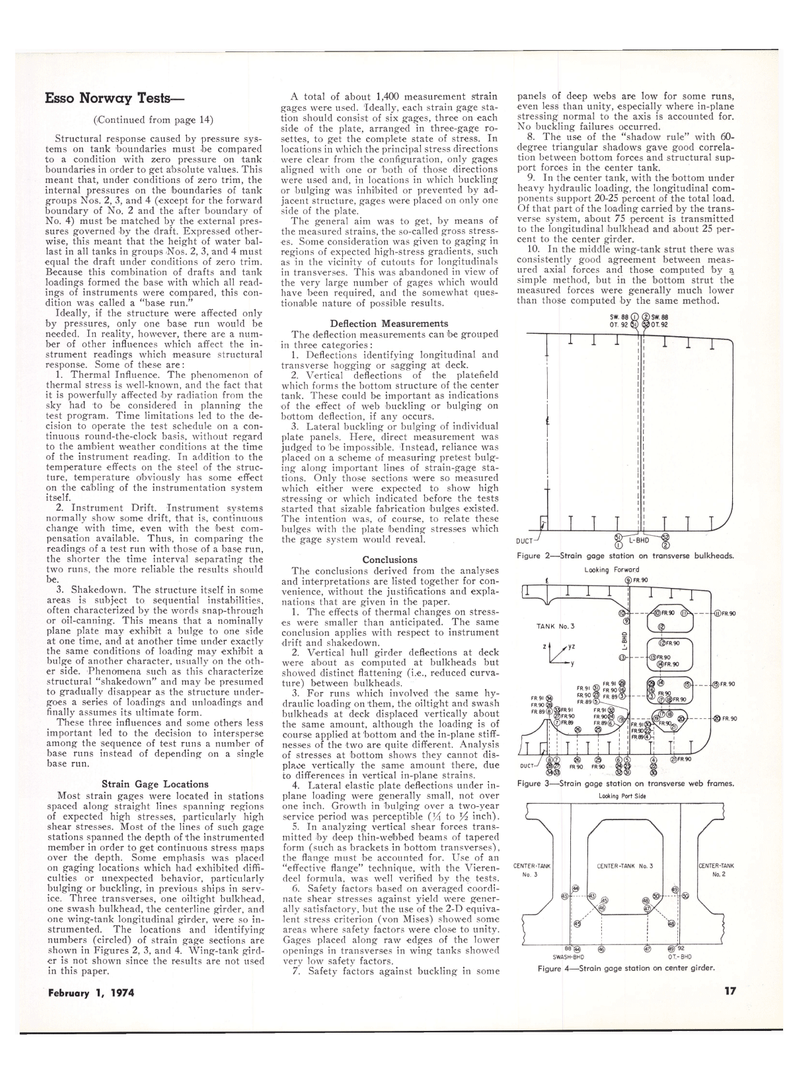
Most strain gages were located in stations
spaced along straight lines spanning regions
of expected high stresses, particularly high
shear stresses. Most of the lines of such gage
stations spanned the depth of the instrumented
member in order to get continuous stress maps
over the depth. Some emphasis was placed
on gaging locations which had exhibited diffi-
culties or unexpected behavior, particularly
bulging or buckling, in previous ships in serv-
ice. Three transverses, one oiltight bulkhead,
one swash bulkhead, 'the centerline girder, and
one wing-tank longitudinal girder, were so in-
strumented. The locations and identifying
numbers (circled) of strain gage sections are
shown in Figures 2, 3, and 4. Wing-tank gird-
er is not shown since the results are not used
in this paper.
A total of about 1,400 measurement strain
gages were used. 'Ideally, each strain gage sta-
tion should consist of six gages, three on each
side of the plate, arranged in three-gage ro-
settes, to get the complete state of stress. In
locations in which the principal stress directions
were clear from the configuration, only gages
aligned with one or both of those directions
were used and, in locations in which buckling
or bulging was inhibited or prevented by ad-
jacent structure, gages were placed on only one
side of the plate.
The general aim was to get, by means of
the measured strains, the so-called gross stress-
es. Some consideration was given to gaging in
regions of expected high-stress gradients, such
as in the vicinity of cutouts for longitudinals
in transverses. This was abandoned in view of
the very large number of gages which would
have been required, and the somewhat ques-
tionable nature of possible results.
Deflection Measurements
The deflection measurements can be grouped
in three categories:
1. Deflections identifying longitudinal and
transverse hogging or sagging a't deck.
2. Vertical deflections of the platefield
which forms the bottom structure of the center
tank. These could be important as indications
of the effect of web buckling or bulging on
bottom deflection, if any occurs.
3. Lateral buckling or bulging of individual
plate panels. Here, direct measurement was
judged to be impossible. Instead, reliance was
placed on a scheme of measuring pretest bulg-
ing along important lines of strain-gage sta-
tions. Only those sections were so measured
which either were expected to show high
stressing or which indicated before the tests
started that sizable fabrication bulges existed.
The intention was, of course, to relate these
bulges with the plate bending stresses which
the gage system would reveal.
Conclusions
The conclusions derived from the analyses
and interpretations are listed together for con-
venience, without the justifications and expla-
nations that are given in the paper.
1. The effects of thermal changes on stress-
es were smaller than anticipated. The same
conclusion applies with respect to instrument
drift and shakedown.
2. Vertical hull girder deflections at deck
were about as computed at bulkheads but
showed distinct flattening (i.e., reduced curva-
ture) between bulkheads.
3. For runs which involved the same hy-
draulic l-oading on 'them, the oiltight and swash
bulkheads at deck displaced vertically about
the same amount, although the loading is of
course applied at bottom and the in-plane stiff-
nesses of the two are quite different. Analysis
of stresses at bottom shows they cannot dis-
place vertically the same amount there, due
to differences in vertical in-plane strains.
4. Lateral elastic plate deflections under in-
plane loading were generally small, not over
one inch. Growth in bulging over a two-year
service period was perceptible (j4 to Yz inch).
5. In analyzing vertical shear forces trans-
mitted by deep thin-webbed beams of tapered
form (such as brackets in bottom transverses),
the flange must be accounted for. Use of an
"effective flange" technique, with the Vieren-
deel formula, was well verified by the tests.
6. Safety factors based on averaged coordi-
nate shear stresses against yield were gener-
ally satisfactory, but the use of the 2-D equiva-
lent stress criterion (von Mises) showed some
areas where safety factors were close to unity.
Gages placed along raw edges of the lower
openings in transverses in wing tanks showed
very low safety factors.
7. Safety factors against buckling in some
panels of deep webs are low for some runs,
even less than unity, especially where in-plane
stressing normal to the axis is accounted for.
No buckling failures occurred.
8. The use of the "shadow rule" with 60-
degree triangular shadows gave good correla-
tion between bottom forces and structural sup-
port forces in the center tank.
9. In the center tank, with the bottom under
heavy hydraulic loading, the longitudinal com-
ponents support 20-25 percent of the total load.
Of that part of the loading carried by the trans-
verse system, about 75 percent is transmitted
to the longitudinal bulkhead and about 25 per-
cent to the center girder.
10. In the middle wing-tank strut there was
consistently good agreement between meas-
ured axial forces and those computed by a
simple method, but in the bottom strut the
measured forces were generally much lower
than those computed by the same method.
r-r-T
DUCT
L±V
Figure 2—Strain gage station on transverse bulkheads.
Looking Forward
©FR.90
-©FR.90
(g>| j FR90
(g)®FR.90 J
~ FR.90
Figure 3—Strain gage station on transverse web frames.
Looking Port Side
CENTER-TANK
No. 3
CENTER-TANK No. 3
t©
1§> ®
CENTER-TANK
No. 2
92
0T.-BHD SWASH-BHD
Figure 4—Strain gage station on center girder.
February 1, 1974 17
