Page 78: of Maritime Reporter Magazine (June 1985)
Read this page in Pdf, Flash or Html5 edition of June 1985 Maritime Reporter Magazine
CANADIAN SHIPBUILDING
CANADIAN SHIPBUILDING — 1985 —
By Henry M. Walsh, President,
Canadian Shipbuilding and Ship Repairing Association
Henry M. Walsh
REVIEW AND OUTLOOK
The data in this annual statistical report brings home hard the fact that the Canadian shipbuilding, ship repairing and allied industries are at the crossroads. Policies must be implemented to strengthen our industry.
A new federal government was elected last September that prom- ised changes in policy to revitalize the shipbuilding, ship repairing and allied industries. The Progressive
Conservative Atlantic caucus said on August 2: "A top priority of a
P.C. government will be to create a more viable and prosperous ship- building industry." But no changes in policy have been brought forward to date, although shipbuilders have
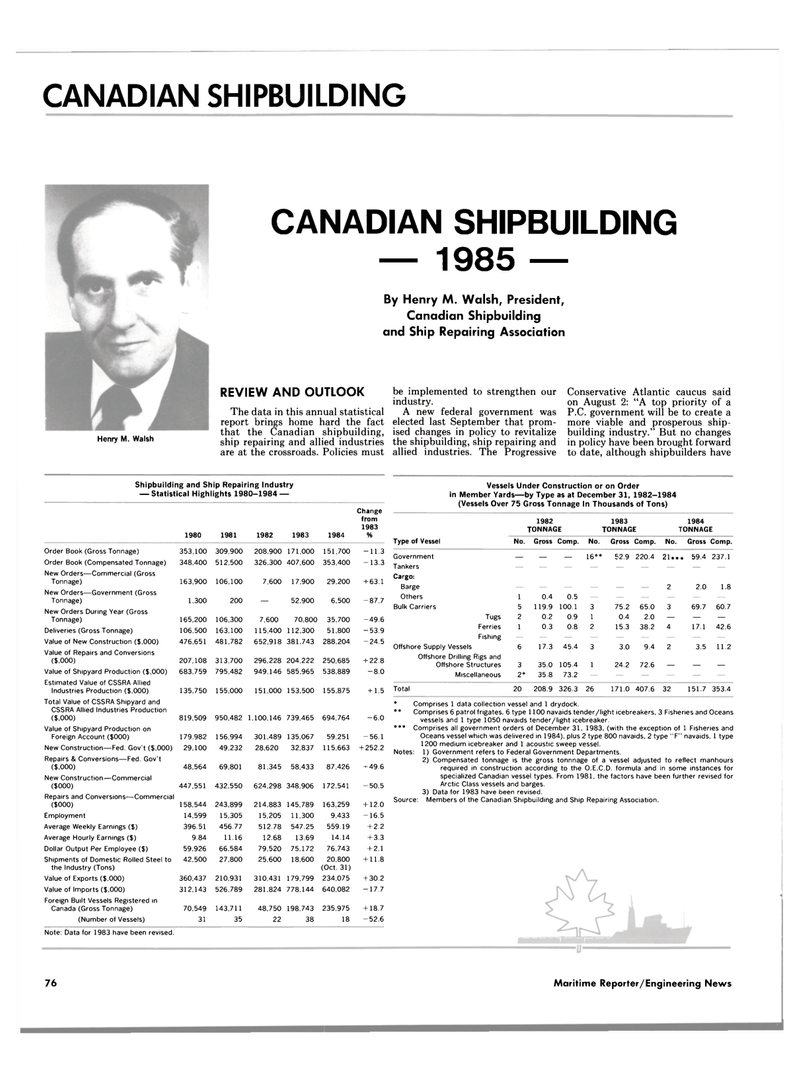
Shipbuilding and Ship Repairing Industry — Statistical Highlights 1980-1984 — 1980 1981 1982 1983 1984
Change from 1983 %
Order Book (Gross Tonnage) 353,100 309.900 208.900 171,000 151,700 -11.3
Order Book (Compensated Tonnage) 348.400 512.500 326.300 407.600 353,400 -13.3
New Orders—Commercial (Gross
Tonnage) 163,900 106.100 7.600 17.900 29,200 + 63.1
New Orders—Government (Gross
Tonnage) 1,300 200 52.900 6,500 -87.7
New Orders During Year (Gross
Tonnage) 165.200 106.300 7,600 70.800 35.700 -49.6
Deliveries (Gross Tonnage) 106.500 163.100 115.400 112,300 51.800 -53 9
Value of New Construction ($.000) 476.651 481.782 652.918 381.743 288,204 -24.5
Value of Repairs and Conversions ($.000) 207,108 313.700 296.228 204.222 250,685 + 22.8
Value of Shipyard Production ($.000) 683.759 795.482 949.146 585.965 538.889 -8.0
Estimated Value of CSSRA Allied
Industries Production ($.000) 135.750 155.000 151.000 153.500 155.875 + 1.5
Total Value of CSSRA Shipyard and
CSSRA Allied Industries Production ($.000) 819.509 950.482 1.100.146 739.465 694.764 -6.0
Value of Shipyard Production on
Foreign Account ($000) 179.982 156.994 301.489 135.067 59.251 -56.1
New Construction—Fed. Gov't ($.000) 29.100 49,232 28.620 32.837 115,663 + 252.2
Repairs & Conversions—Fed. Gov't ($.000) 48.564 69,801 81,345 58,433 87.426 ^49.6
New Construction—Commercial ($000) 447,551 432,550 624,298 348,906 172.541 -50.5
Repairs and Conversions—Commercial ($000) 158.544 243,899 214,883 145,789 163.259 + 12.0
Employment 14,599 15,305 15,205 11,300 9.433 -16.5
Average Weekly Earnings ($) 396.51 456.77 512.78 547.25 559.19 + 2.2
Average Hourly Earnings ($) 9.84 11.16 12.68 13.69 14.14 + 3.3
Dollar Output Per Employee ($) 59,926 66.584 79,520 75.172 76.743 + 2.1
Shipments of Domestic Rolled Steel to the Industry (Tons) 42.500 27.800 25.600 18.600 20.800 (Oct. 31) + 11.8
Value of Exports ($.000) 360.437 210.931 310.431 179,799 234.075 + 30.2
Value of Imports ($.000) 312.143 526.789 281,824 778.144 640.082 -17.7
Foreign Built Vessels Registered in
Canada (Gross Tonnage) 70.549 143,711 48.750 198.743 235,975 + 18.7 (Number of Vessels) 31 35 22 38 18 -52.6
Vessels Under Construction or on Order in Member Yards—by Type as at December 31, 1982-1984 (Vessels Over 75 Gross Tonnage In Thousands of Tons) 1982 1983 1984
TONNAGE TONNAGE TONNAGE
Type of Vessel No. Gross Comp. No. Gross Comp. No. Gross Comp.
Government — — — 16»* 52.9 220.4 21... 59.4 237.1
Tankers — — — — — — — —
Cargo:
Barge ______ 2 2.0 1.8
Others 1 0.4 0.5 — — — — — —
Bulk Carriers 5 119.9 100.1 3 75.2 65.0 3 69.7 60.7
Tugs 2 0.2 0.9 1 0.4 2.0 — — —
Ferries 1 0.3 0.8 2 15.3 38.2 4 17.1 42.6
Fishing — — — — — — — — —
Offshore Supply Vessels 6 17.3 45.4 3 3.0 9.4 2 3.5 11.2
Offshore Drilling Rigs and
Offshore Structures 3 35.0 105.4 1 24.2 72.6 — — —
Miscellaneous 2* 35.8 73.2 — — — — — —
Total 20 208.9 326.3 26 171.0 407.6 32 151.7 353.4 * Comprises 1 data collection vessel and 1 drydock. ** Comprises 6 patrol frigates, 6 type 1100 navaids tender/light icebreakers, 3 Fisheries and Oceans vessels and 1 type 1050 navaids tender/light icebreaker. *** Comprises all government orders of December 31, 1983, (with the exception of 1 Fisheries and
Oceans vessel which was delivered in 1984), plus 2 type 800 navaids, 2 type "F" navaids, 1 type 1200 medium icebreaker and 1 acoustic sweep vessel.
Notes: 1) Government refers to Federal Government Departments. 2) Compensated tonnage is the gross tonnnage of a vessel adjusted to reflect manhours required in construction according to the O.E.C.D. formula and in some instances for specialized Canadian vessel types. From 1981, the factors have been further revised for
Arctic Class vessels and barges. 3) Data for 1983 have been revised.
Source: Members of the Canadian Shipbuilding and Ship Repairing Association.
Note: Data for 1983 have been revised. 76 Maritime Reporter/Engineering News

 77
77

 79
79
