Page 16: of Maritime Reporter Magazine (August 1986)
Read this page in Pdf, Flash or Html5 edition of August 1986 Maritime Reporter Magazine
 15
15
 17
17
America's Seaports (continued) ships and T-2 tankers—have been all but totally replaced by huge tankers, drybulk carriers, container- ship car carriers, refrigerated ships, and a bewildering variety of other highly specialized vessel types.
Ships, on average, have become larger, technologically more sophis- ticated, and significantly more ex- pensive to build and to operate, requiring equally sophisticated ports to turn them around quickly and keep them on schedule. In re- sponse, more than $5 billion was invested in commercial port facili- ties in the United States from 1946 through 1980. During the period 1973-1983, public port authorities alone invested some $3.0 billion in facilities, and are expected to invest another $3.2 billion in capital im- provements between 1983 and 1989, according to the Maritime Adminis- tration. More detail as to the pat- tern of future investment is pro- vided in Table 1.
Note that the Maritime Adminis- tration's forecasts do not include port-related investments by pri- vate-sector entities, such as coal, petroleum, and grain companies.
Most public port authorities are general purpose in nature with each catering in varying degrees to all types of cargo, bulk, and nonbulk.
Leading petroleum import centers are the ports of New York and New
Jersey, the Delaware River, the low- er Mississippi, the Gulf Coast, and southern California. Coal is shipped in greatest volume from Philadel- phia, Hampton Roads, Baltimore,
Mobile, New Orleans, and certain ports on the Great Lakes. The Gulf,
Pacific Northwest, and the Great
Lakes are prime grain exporting areas. Log and timber exports are a specialty of the ports in Oregon and the state of Washington, iron ore of the Great Lakes, and tobacco of the ports of Virginia and North Caro- lina.
Most U.S. ports are equipped with general cargo terminals—facil- ities at which merchandise is han- dled in containers, boxes, barrels, and bales. Thousands of imported automobiles are unloaded at various ports on the East, Gulf, and West
Coasts. While regular, transoceanic passenger service is largely a histor- ic memory, a number of U.S. ports are finding the expanding cruise- ship business to be extremely lucra- tive and a considerable source of local economic benefit.
The onset of the 1980s brought with it a host of economic difficul- ties for U.S. ports. Cargo volumes dropped. Foreign cargo at U.S. ports declined from the 1979 peak to a low of 735.1 million tons in 1983. The sharpest decline occurred in petro- leum imports, reflected the com- bined effects of the OPEC price hikes, the recession in the U.S. econ- omy, conservation efforts, and the substitution of coal and other domestic fuels for foreign oil. High unemployment and the depressed (continued)
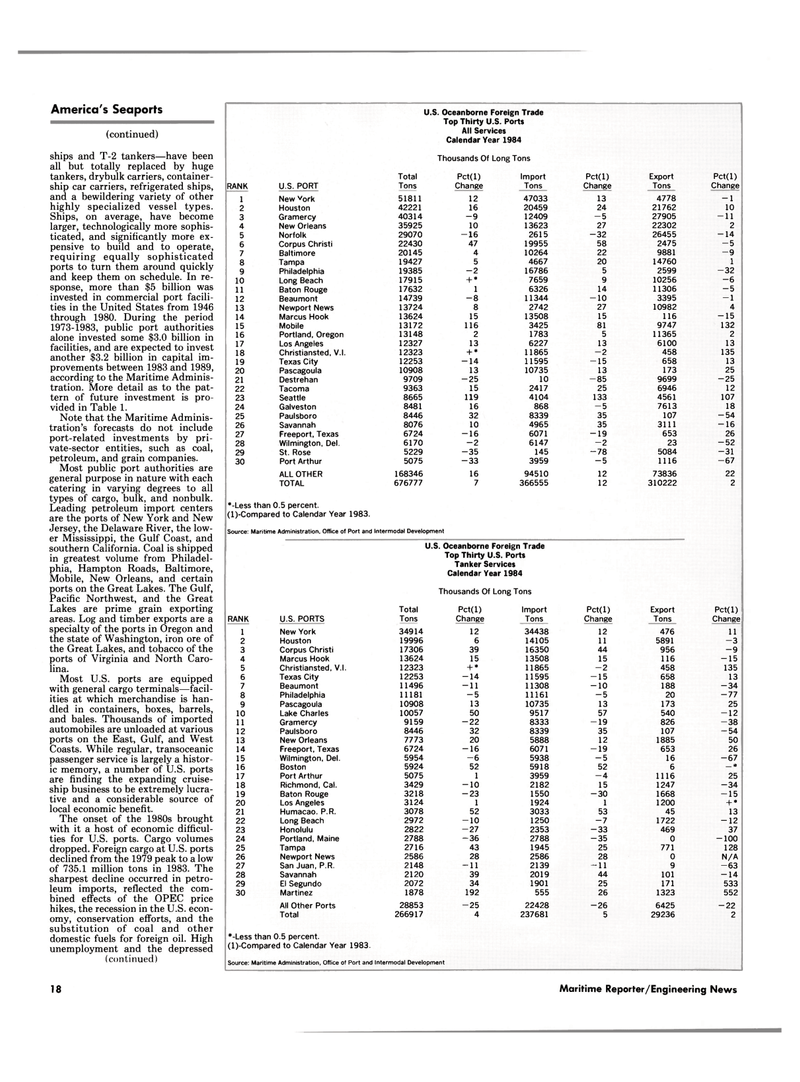
U.S. Oceanborne Foreign Trade
Top Thirty U.S. Ports
All Services
Calendar Year 1984
Thousands Of Long Tons
Total Pct(l) Import Pct(l) Export Pct(l)
RANK U.S. PORT Tons Change Tons Change Tons Change 1 New vork 51811 12 47033 13 4778 -1 2 Houston 42221 16 20459 24 21762 10 3 Gramercy 40314 -9 12409 -5 27905 -11 4 New Orleans 35925 10 13623 27 22302 2 5 Norfolk 29070 -16 2615 -32 26455 -14 6 Corpus Christi 22430 47 19955 58 2475 -5 7 Baltimore 20145 4 10264 22 9881 -9 8 Tampa 19427 5 4667 20 14760 1 9 Philadelphia 19385 -2 16786 5 2599 -32 10 Long Beach 17915 + * 7659 9 10256 -6 11 Baton Rouge 17632 1 6326 14 11306 -5 12 Beaumont 14739 -8 11344 -10 3395 -1 13 Newport News 13724 8 2742 27 10982 4 14 Marcus Hook 13624 15 13508 15 116 -15 15 Mobile 13172 116 3425 81 9747 132 16 Portland, Oregon 13148 2 1783 5 11365 2 17 Los Angeles 12327 13 6227 13 6100 13 18 Christiansted, V.I. 12323 + * 11865 -2 458 135 19 Texas City 12253 -14 11595 -15 658 13 20 Pascagoula 10908 13 10735 13 173 25 21 Destrehan 9709 -25 10 -85 9699 -25 22 Tacoma 9363 15 2417 25 6946 12 23 Seattle 8665 119 4104 133 4561 107 24 Galveston 8481 16 868 -5 7613 18 25 Paulsboro 8446 32 8339 35 107 -54 26 Savannah 8076 10 4965 35 3111 -16 27 Freeport, Texas 6724 -16 6071 -19 653 26 28 Wilmington, Del. 6170 -2 6147 -2 23 -52 29 St. Rose 5229 -35 145 -78 5084 -31 30 Port Arthur 5075 -33 3959 -5 1116 -67
ALL OTHER 168346 16 94510 12 73836 22
TOTAL 676777 7 366555 12 310222 2 *-Less than 0.5 percent. (l)-Compared to Calendar Year 1983.
Source: Maritime Administration. Office of Port and Intermodal Development
U.S. Oceanborne Foreign Trade
Top Thirty U.S. Ports
Tanker Services
Calendar Year 1984
Thousands Of Long Tons
Total Pct(l) Import Pct(l) Export Pct(l)
RANK U.S. PORTS Tons Change Tons Change Tons Change' 1 New York 34914 12 34438 12 476 11 2 Houston 19996 6 14105 11 5891 -3 3 Corpus Christi 17306 39 16350 44 956 -9 4 Marcus Hook 13624 15 13508 15 116 -15 5 Christiansted, V.I. 12323 + * 11865 -2 458 135 6 Texas City 12253 -14 11595 -15 658 13 7 Beaumont 11496 -11 11308 -10 188 -34 8 Philadelphia 11181 -5 11161 -5 20 -77 9 Pascagoula 10908 13 10735 13 173 25 10 Lake Charles 10057 50 9517 57 540 -12 11 Gramercy 9159 -22 8333 -19 826 -38 12 Paulsboro 8446 32 8339 35 107 -54 13 New Orleans 7773 20 5888 12 1885 50 14 Freeport, Texas 6724 -16 6071 -19 653 26 15 Wilmington, Del. 5954 -6 5938 -5 16 -67 16 Boston 5924 52 5918 52 6 * 17 Port Arthur 5075 1 3959 -4 1116 25 18 Richmond, Cat. 3429 -10 2182 15 1247 -34 19 Baton Rouge 3218 -23 1550 -30 1668 -15 20 Los Angeles 3124 1 1924 1 1200 + * 21 Humacao. P.R. 3078 52 3033 53 45 13 22 Long Beach 2972 -10 1250 -7 1722 -12 23 Honolulu 2822 -27 2353 -33 469 37 24 Portland, Maine 2788 -36 2788 -35 0 -100 25 Tampa 2716 43 1945 25 771 128 26 Newport News 2586 28 2586 28 0 N/A 27 San Juan, P R. 2148 -11 2139 -11 9 -63 28 Savannah 2120 39 2019 44 101 -14 29 El Segundo 2072 34 1901 25 171 533 30 Martinez 1878 192 555 26 1323 552
All Other Ports 28853 -25 22428 -26 6425 -22
Total 266917 4 237681 5 29236 2 "-Less than 0.5 percent. (l)-Compared to Calendar Year 1983.
Source: Maritime Administration. Office of Port and Intermodal Development 18 Maritime Reporter/Engineering News
