Page 28: of Maritime Reporter Magazine (September 1988)
Read this page in Pdf, Flash or Html5 edition of September 1988 Maritime Reporter Magazine
 27
27
 29
29
U.S. NAVY (continued) complished under multiship, mul- tiyear contracts where one contrac- tor is responsible for a particular group of ships.
Progressive maintenance—
In the 1970s the Navy initiated a new ship logistics concept which emphasizes performing mainte- nance and repair at intermediate and depot level activities. The guided missile frigate (FFG 7), hy- drofoil patrol boat (PHM 1) and
Trident submarine (SSBN 726) have been designed with this main- tenance concept as an objective.
Crew size has been minimized and equipment is designed for compo- nent removal and replacement.
For the FFG 7 class, a prescribed set of maintenance actions are to be performed at intermediate mainte- nance availabilities (IMAs) and se- lected restriced availabilities (SRAs). IMAs are scheduled at six- month intervals, with three weeks planned for maintenance work.
SRAs are to be scheduled every two years, lasting about four weeks.
Every ten years a major moderniza- tion is scheduled.
Spending Pattern for
Maintenance and
Modernization
Navy spending for ship mainte- nance and modernization has in- creased from about $1.6 billion in 1975 to $5.6 billion in 1987. Taking into account the growth in fleet size, average maintenance expenditure per ship has grown from $2.3 million per year to $7.8 million per year during this period. Average modern- ization expenditure has increased from $.9 million to $2.5 million per ship/year.
Budget pressures have recently created a buildup in deferred main- tenance. The clearest evidence is the decline in maintenance and modernization expenditure per ship over the past four years. In 1985 the
Navy spent an average of $11.4 mil- lion per ship for maintenance and modernization. This figure is pro- jected to be $8.5 million in 1988 and $8.7 million in 1989.
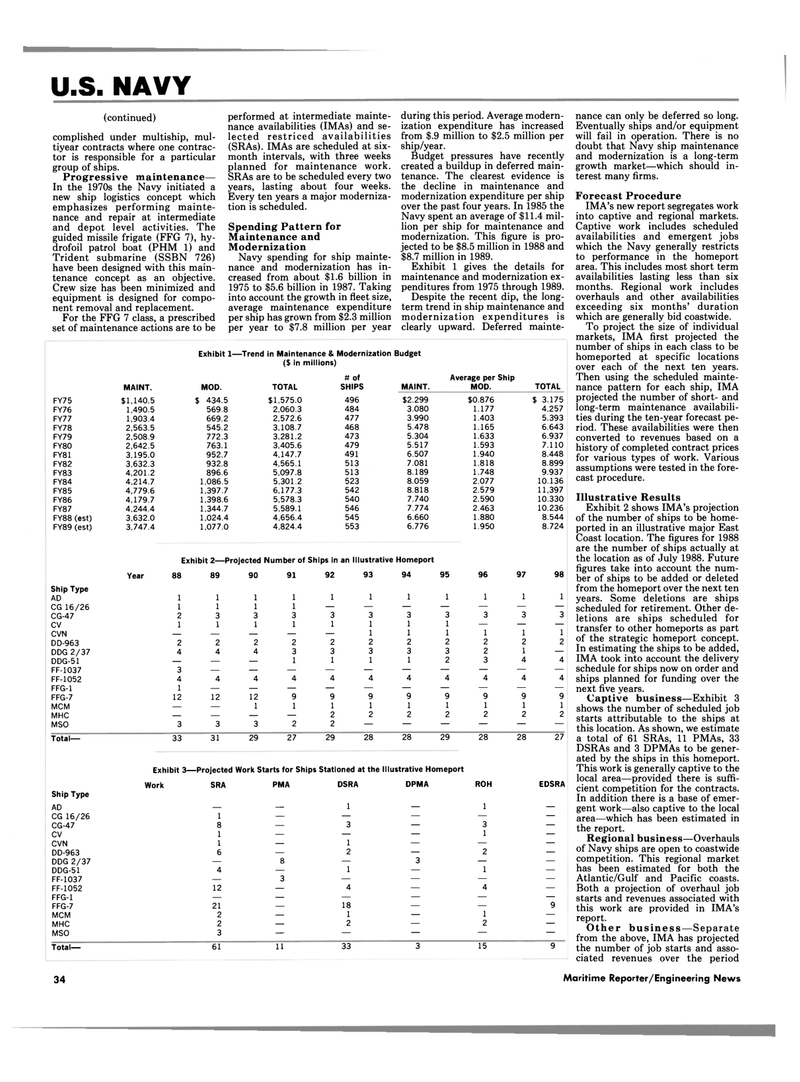
Exhibit 1 gives the details for maintenance and modernization ex- penditures from 1975 through 1989.
Despite the recent dip, the long- term trend in ship maintenance and modernization expenditures is clearly upward. Deferred mainte- nance can only be deferred so long.
Eventually ships and/or equipment will fail in operation. There is no doubt that Navy ship maintenance and modernization is a long-term growth market—which should in- terest many firms.
Forecast Procedure
IMA's new report segregates work into captive and regional markets.
Captive work includes scheduled availabilities and emergent jobs which the Navy generally restricts to performance in the homeport area. This includes most short term availabilities lasting less than six months. Regional work includes overhauls and other availabilities exceeding six months' duration which are generally bid coastwide.
To project the size of individual markets, IMA first projected the number of ships in each class to be homeported at specific locations over each of the next ten years.
Then using the scheduled mainte- nance pattern for each ship, IMA projected the number of short- and long-term maintenance availabili- ties during the ten-year forecast pe- riod. These availabilities were then converted to revenues based on a history of completed contract prices for various types of work. Various assumptions were tested in the fore- cast procedure.
Illustrative Results
Exhibit 2 shows IMA's projection of the number of ships to be home- ported in an illustrative major East
Coast location. The figures for 1988 are the number of ships actually at the location as of July 1988. Future figures take into account the num- ber of ships to be added or deleted from the homeport over the next ten years. Some deletions are ships scheduled for retirement. Other de- letions are ships scheduled for transfer to other homeports as part of the strategic homeport concept.
In estimating the ships to be added,
IMA took into account the delivery schedule for ships now on order and ships planned for funding over the next five years.
Captive business—Exhibit 3 shows the number of scheduled job starts attributable to the ships at this location. As shown, we estimate a total of 61 SRAs, 11 PMAs, 33
DSRAs and 3 DPMAs to be gener- ated by the ships in this homeport.
This work is generally captive to the local area—provided there is suffi- cient competition for the contracts.
In addition there is a base of emer- gent work—also captive to the local area—which has been estimated in the report.
Regional business—Overhauls of Navy ships are open to coastwide competition. This regional market has been estimated for both the
Atlantic/Gulf and Pacific coasts.
Both a projection of overhaul job starts and revenues associated with this work are provided in IMA's report.
Other business—Separate from the above, IMA has projected the number of job starts and asso- ciated revenues over the period
Exhibit 1—Trend in Maintenance & Modernization Budget ($ in millions) # of Average per Ship
MAINT. MOD. TOTAL SHIPS MAINT. MOD. TOTAL
FY75 $1,140.5 $ 434.5 $1,575.0 496 $2,299 $0,876 $ 3.175
FY76 1,490.5 569.8 2,060.3 484 3.080 1.177 4.257
FY77 1,903.4 669.2 2,572.6 477 3.990 1.403 5.393
FY78 2,563.5 545.2 3,108.7 468 5.478 1.165 6.643
FY79 2,508.9 772.3 3,281.2 473 5.304 1.633 6.937
FY80 2,642.5 763.1 3,405.6 479 5.517 1.593 7.110
FY81 3,195.0 952.7 4,147.7 491 6.507 1.940 8.448
FY82 3,632.3 932.8 4,565.1 513 7.081 1.818 8.899
FY83 4,201.2 896.6 5,097.8 513 8.189 1.748 9.937
FY84 4,214.7 1,086.5 5,301.2 523 8.059 2.077 10.136
FY85 4,779.6 1,397.7 6.177.3 542 8.818 2.579 11,397
FY86 4,179.7 1,398.6 5,578.3 540 7.740 2.590 10.330
FY87 4,244.4 1,344.7 5,589.1 546 7.774 2.463 10.236
FY88 (est) 3,632.0 1,024.4 4,656.4 545 6.660 1.880 8.544
FY89 (est) 3,747.4 1,077.0 4,824.4 553 6.776 1.950 8.724
Exhibit 2—Projected Number of Ships in an Illustrative Homeport
Year 88 89 90 91 92 93 94 95 96 97 98
Ship Type 1 1 AD 1 1 1 1 1 1 1 1 1
CG 16/26 1 1 1 1 — — — — — — —
CG-47 2 3 3 3 3 3 3 3 3 3 3 cv 1 1 1 1 1 1 1 1 — — —
CVN — — — — — 1 1 1 1 1 1
DD-963 2 2 2 2 2 2 2 2 2 2 2
DDG 2/37 4 4 4 3 3 3 3 3 2 1 —
DDG-51 — — — 1 1 1 1 2 3 4 4
FF-1037 3 — — — — — — — — — —
FF-1052 4 4 4 4 4 4 4 4 4 4 4
FFG-1 1 — — — — — — — — — —
FFG-7 12 12 12 9 9 9 9 9 9 9 9
MCM — — 1 1 1 1 1 1 1 1 1
MHC — — — — 2 2 2 2 2 2 2
MSO 3 3 3 2 2 — — — — — —
Total— 33 31 29 27 29 28 28 29 28 28 27
Exhibit 3—Projected Work Starts for Ships Stationed at the Illustrative Homeport
Work SRA PMA DSRA DPMA ROH EDSRA
Ship Type
AD — — 1 — 1 —
CG 16/26 1 — — — — —
CG-47 8 — 3 — 3 —
CV 1 — — — 1 —
CVN 1 — 1 — — —
DD-963 6 — 2 — 2 —
DDG 2/37 — 8 — 3 — —
DDG-51 4 — 1 — 1 —
FF-1037 — 3 — — — —
FF-1052 12 — 4 — 4 —
FFG-1 — — — — — —
FFG-7 21 — 18 — — 9
MCM 2 — 1 — 1 —
MHC 2 — 2 — 2 —
MSO 3 — — — — —
Total— 61 11 33 3 15 9 34 Maritime Reporter/Engineering News
