
Page 86: of Maritime Reporter Magazine (June 2011)
Feature: Annual World Yearbook
Read this page in Pdf, Flash or Html5 edition of June 2011 Maritime Reporter Magazine
 85
85
 87
87
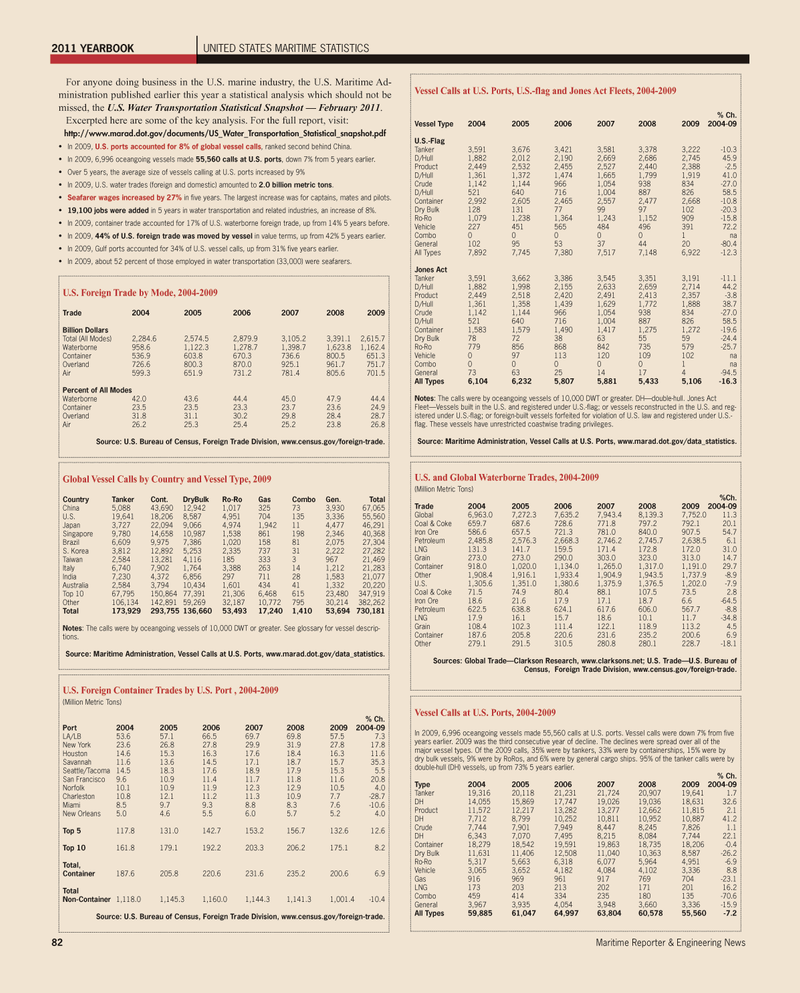
82Maritime Reporter & Engineering News 2011 YEARBOOKUNITED STATES MARITIME STATISTICS Vessel Calls at U.S. Ports, U.S.-flag and Jones Act Fleets, 2004-2009 % Ch. Vessel Type 2004 2005 2006 2007 2008 2009 2004-09 U.S.-Flag Tanker 3,591 3,676 3,421 3,581 3,378 3,222 -10.3 D/Hull 1,882 2,012 2,190 2,669 2,686 2,745 45.9 Product 2,449 2,532 2,455 2,527 2,440 2,388 -2.5 D/Hull 1,361 1,372 1,474 1,665 1,799 1,919 41.0 Crude 1,142 1,144 966 1,054 938 834 -27.0 D/Hull 521 640 716 1,004 887 826 58.5 Container 2,992 2,605 2,465 2,557 2,477 2,668 -10.8 Dry Bulk 128 131 77 99 97 102 -20.3 Ro-Ro 1,079 1,238 1,364 1,243 1,152 909 -15.8 Vehicle 227 451 565 484 496 391 72.2 Combo 0 0 0 0 0 1 na General 102 95 53 37 44 20 -80.4 All Types 7,892 7,745 7,380 7,517 7,148 6,922 -12.3 Jones Act Tanker 3,591 3,662 3,386 3,545 3,351 3,191 -11.1 D/Hull 1,882 1,998 2,155 2,633 2,659 2,714 44.2 Product 2,449 2,518 2,420 2,491 2,413 2,357 -3.8 D/Hull 1,361 1,358 1,439 1,629 1,772 1,888 38.7 Crude 1,142 1,144 966 1,054 938 834 -27.0 D/Hull 521 640 716 1,004 887 826 58.5 Container 1,583 1,579 1,490 1,417 1,275 1,272 -19.6 Dry Bulk 78 72 38 63 55 59 -24.4 Ro-Ro 779 856 868 842 735 579 -25.7 Vehicle 0 97 113 120 109 102 na Combo 0 0 0 0 0 1 na General 73 63 25 14 17 4 -94.5 All Types 6,104 6,232 5,807 5,881 5,433 5,106 -16.3 Notes: The calls were by oceangoing vessels of 10,000 DWT or greater. DH?double-hull. Jones Act Fleet?Vessels built in the U.S. and registered under U.S.-flag; or vessels reconstructed in the U.S. and reg- istered under U.S.-flag; or foreign-built vessels forfeited for violation of U.S. law and registered under U.S.- flag. These vessels have unrestricted coastwise trading privileges. Source: Maritime Administration, Vessel Calls at U.S. Ports, www.marad.dot.gov/data_statistics. Global Vessel Calls by Country and Vessel Type, 2009 Country Tanker Cont. DryBulk Ro-Ro Gas Combo Gen. Total China 5,088 43,690 12,942 1,017 325 73 3,930 67,065 U.S. 19,641 18,206 8,587 4,951 704 135 3,336 55,560 Japan 3,727 22,094 9,066 4,974 1,942 11 4,477 46,291 Singapore 9,780 14,658 10,987 1,538 861 198 2,346 40,368 Brazil 6,609 9,975 7,386 1,020 158 81 2,075 27,304 S. Korea 3,812 12,892 5,253 2,335 737 31 2,222 27,282 Taiwan 2,584 13,281 4,116 185 333 3 967 21,469 Italy 6,740 7,902 1,764 3,388 263 14 1,212 21,283 India 7,230 4,372 6,856 297 711 28 1,583 21,077 Australia 2,584 3,794 10,434 1,601 434 41 1,332 20,220 Top 10 67,795 150,864 77,391 21,306 6,468 615 23,480 347,919 Other 106,134 142,891 59,269 32,187 10,772 795 30,214 382,262 Total 173,929 293,755 136,660 53,493 17,240 1,410 53,694 730,181 Notes: The calls were by oceangoing vessels of 10,000 DWT or greater. See glossary for vessel descrip- tions.Source: Maritime Administration, Vessel Calls at U.S. Ports, www.marad.dot.gov/data_statistics. Vessel Calls at U.S. Ports, 2004-2009 In 2009, 6,996 oceangoing vessels made 55,560 calls at U.S. ports. Vessel calls were down 7% from five years earlier. 2009 was the third consecutive year of decline. The declines were spread over all of the major vessel types. Of the 2009 calls, 35% were by tankers, 33% were by containerships, 15% were by dry bulk vessels, 9% were by RoRos, and 6% were by general cargo ships. 95% of the tanker calls were by double-hull (DH) vessels, up from 73% 5 years earlier. % Ch. Type 2004 2005 2006 2007 2008 2009 2004-09 Tanker 19,316 20,118 21,231 21,724 20,907 19,641 1.7 DH 14,055 15,869 17,747 19,026 19,036 18,631 32.6 Product 11,572 12,217 13,282 13,277 12,662 11,815 2.1 DH 7,712 8,799 10,252 10,811 10,952 10,887 41.2 Crude 7,744 7,901 7,949 8,447 8,245 7,826 1.1 DH 6,343 7,070 7,495 8,215 8,084 7,744 22.1 Container 18,279 18,542 19,591 19,863 18,735 18,206 -0.4 Dry Bulk 11,631 11,406 12,508 11,040 10,363 8,587 -26.2 Ro-Ro 5,317 5,663 6,318 6,077 5,964 4,951 -6.9 Vehicle 3,065 3,652 4,182 4,084 4,102 3,336 8.8 Gas 916 969 961 917 769 704 -23.1 LNG 173 203 213 202 171 201 16.2 Combo 459 414 334 235 180 135 -70.6 General 3,967 3,935 4,054 3,948 3,660 3,336 -15.9 All Types 59,885 61,047 64,997 63,804 60,578 55,560 -7.2 U.S. and Global Waterborne Trades, 2004-2009 (Million Metric Tons) %Ch. Trade 2004 2005 2006 2007 2008 2009 2004-09 Global 6,963.0 7,272.3 7,635.2 7,943.4 8,139.3 7,752.0 11.3 Coal & Coke 659.7 687.6 728.6 771.8 797.2 792.1 20.1 Iron Ore 586.6 657.5 721.3 781.0 840.0 907.5 54.7 Petroleum 2,485.8 2,576.3 2,668.3 2,746.2 2,745.7 2,638.5 6.1 LNG 131.3 141.7 159.5 171.4 172.8 172.0 31.0 Grain 273.0 273.0 290.0 303.0 323.0 313.0 14.7 Container 918.0 1,020.0 1,134.0 1,265.0 1,317.0 1,191.0 29.7 Other 1,908.4 1,916.1 1,933.4 1,904.9 1,943.5 1,737.9 -8.9 U.S. 1,305.6 1,351.0 1,380.6 1,375.9 1,376.5 1,202.0 -7.9 Coal & Coke 71.5 74.9 80.4 88.1 107.5 73.5 2.8 Iron Ore 18.6 21.6 17.9 17.1 18.7 6.6 -64.5 Petroleum 622.5 638.8 624.1 617.6 606.0 567.7 -8.8 LNG 17.9 16.1 15.7 18.6 10.1 11.7 -34.8 Grain 108.4 102.3 111.4 122.1 118.9 113.2 4.5 Container 187.6 205.8 220.6 231.6 235.2 200.6 6.9 Other 279.1 291.5 310.5 280.8 280.1 228.7 -18.1 Sources: Global Trade?Clarkson Research, www.clarksons.net; U.S. Trade?U.S. Bureau of Census, Foreign Trade Division, www.census.gov/foreign-trade. U.S. Foreign Trade by Mode, 2004-2009 Trade 2004 2005 2006 2007 2008 2009 Billion Dollars Total (All Modes) 2,284.6 2,574.5 2,879.9 3,105.2 3,391.1 2,615.7 Waterborne 958.6 1,122.3 1,278.7 1,398.7 1,623.8 1,162.4 Container 536.9 603.8 670.3 736.6 800.5 651.3 Overland 726.6 800.3 870.0 925.1 961.7 751.7 Air 599.3 651.9 731.2 781.4 805.6 701.5 Percent of All Modes Waterborne 42.0 43.6 44.4 45.0 47.9 44.4 Container 23.5 23.5 23.3 23.7 23.6 24.9 Overland 31.8 31.1 30.2 29.8 28.4 28.7 Air 26.2 25.3 25.4 25.2 23.8 26.8 Source: U.S. Bureau of Census, Foreign Trade Division, www.census.gov/foreign-trade. U.S. Foreign Container Trades by U.S. Port , 2004-2009 (Million Metric Tons) % Ch. Port 2004 2005 2006 2007 2008 2009 2004-09 LA/LB 53.6 57.1 66.5 69.7 69.8 57.5 7.3 New York 23.6 26.8 27.8 29.9 31.9 27.8 17.8 Houston 14.6 15.3 16.3 17.6 18.4 16.3 11.6 Savannah 11.6 13.6 14.5 17.1 18.7 15.7 35.3 Seattle/Tacoma 14.5 18.3 17.6 18.9 17.9 15.3 5.5 San Francisco 9.6 10.9 11.4 11.7 11.8 11.6 20.8 Norfolk 10.1 10.9 11.9 12.3 12.9 10.5 4.0 Charleston 10.8 12.1 11.2 11.3 10.9 7.7 -28.7 Miami 8.5 9.7 9.3 8.8 8.3 7.6 -10.6 New Orleans 5.0 4.6 5.5 6.0 5.7 5.2 4.0 Top 5 117.8 131.0 142.7 153.2 156.7 132.6 12.6 Top 10 161.8 179.1 192.2 203.3 206.2 175.1 8.2 Total, Container 187.6 205.8 220.6 231.6 235.2 200.6 6.9 Total Non-Container 1,118.0 1,145.3 1,160.0 1,144.3 1,141.3 1,001.4 -10.4 Source: U.S. Bureau of Census, Foreign Trade Division, www.census.gov/foreign-trade. For anyone doing business in the U.S. marine industry, the U.S. Maritime Ad- ministration published earlier this year a statistical analysis which should not bemissed, the U.S. Water Transportation Statistical Snapshot ? February 2011 .Excerpted here are some of the key analysis. For the full report, visit: http://www.marad.dot.gov/documents/US_Water_Transportation_Statistical_snapshot.pdf ?In 2009, U.S. ports accounted for 8% of global vessel calls , ranked second behind China.?In 2009, 6,996 oceangoing vessels made 55,560 calls at U.S. ports , down 7% from 5 years earlier. ?Over 5 years, the average size of vessels calling at U.S. ports increased by 9% ?In 2009, U.S. water trades (foreign and domestic) amounted to 2.0 billion metric tons. ?Seafarer wages increased by 27% in five years. The largest increase was for captains, mates and pilots. ?19,100 jobs were addedin 5 years in water transportation and related industries, an increase of 8%. ?In 2009, container trade accounted for 17% of U.S. waterborne foreign trade, up from 14% 5 years before. ?In 2009, 44% of U.S. foreign trade was moved by vessel in value terms, up from 42% 5 years earlier. ?In 2009, Gulf ports accounted for 34% of U.S. vessel calls, up from 31% five years earlier. ?In 2009, about 52 percent of those employed in water transportation (33,000) were seafarers.
