
Page 38: of Maritime Reporter Magazine (June 2013)
Annual World Yearbook
Read this page in Pdf, Flash or Html5 edition of June 2013 Maritime Reporter Magazine
 37
37
 39
39
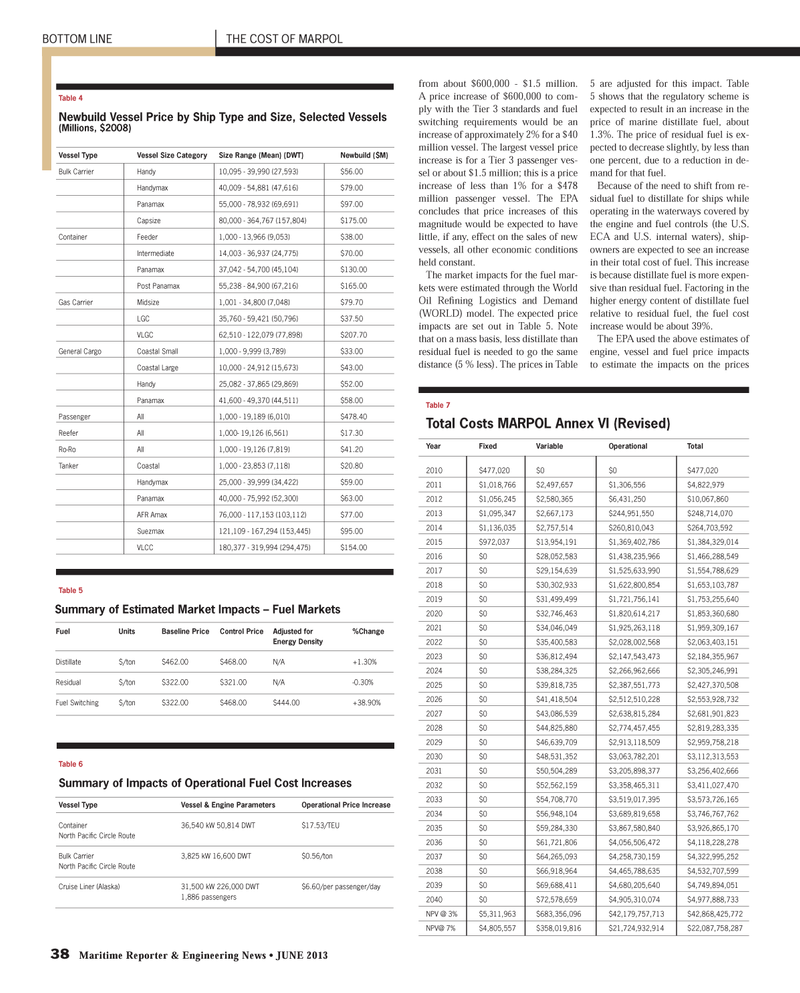
38 Maritime Reporter & Engineering News ? JUNE 2013 from about $600,000 - $1.5 million. A price increase of $600,000 to com- ply with the Tier 3 standards and fuel switching requirements would be an increase of approximately 2% for a $40 million vessel. The largest vessel price increase is for a Tier 3 passenger ves- sel or about $1.5 million; this is a price increase of less than 1% for a $478 million passenger vessel. The EPA concludes that price increases of this magnitude would be expected to have little, if any, effect on the sales of new vessels, all other economic conditions held constant.The market impacts for the fuel mar- kets were estimated through the World Oil ReÞ ning Logistics and Demand (WORLD) model. The expected price impacts are set out in Table 5. Note that on a mass basis, less distillate than residual fuel is needed to go the same distance (5 % less). The prices in Table 5 are adjusted for this impact. Table 5 shows that the regulatory scheme is expected to result in an increase in the price of marine distillate fuel, about 1.3%. The price of residual fuel is ex- pected to decrease slightly, by less than one percent, due to a reduction in de-mand for that fuel.Because of the need to shift from re-sidual fuel to distillate for ships while operating in the waterways covered by the engine and fuel controls (the U.S. ECA and U.S. internal waters), ship- owners are expected to see an increase in their total cost of fuel. This increase is because distillate fuel is more expen-sive than residual fuel. Factoring in the higher energy content of distillate fuel relative to residual fuel, the fuel cost increase would be about 39%.The EPA used the above estimates of engine, vessel and fuel price impacts to estimate the impacts on the prices BOTTOM LINE THE COST OF MARPOL Table 4 Newbuild Vessel Price by Ship Type and Size, Selected Vessels (Millions, $2008) Vessel Type Vessel Size Category Size Range (Mean) (DWT) Newbuild ($M) Bulk Carrier Handy 10,095 - 39,990 (27,593) $56.00 Handymax 40,009 - 54,881 (47,616) $79.00 Panamax 55,000 - 78,932 (69,691) $97.00 Capsize 80,000 - 364,767 (157,804) $175.00 Container Feeder 1,000 - 13,966 (9,053) $38.00 Intermediate 14,003 - 36,937 (24,775) $70.00 Panamax 37,042 - 54,700 (45,104) $130.00 Post Panamax 55,238 - 84,900 (67,216) $165.00Gas Carrier Midsize 1,001 - 34,800 (7,048) $79.70 LGC 35,760 - 59,421 (50,796) $37.50 VLGC 62,510 - 122,079 (77,898) $207.70General Cargo Coastal Small 1,000 - 9,999 (3,789) $33.00 Coastal Large 10,000 - 24,912 (15,673) $43.00 Handy 25,082 - 37,865 (29,869) $52.00 Panamax 41,600 - 49,370 (44,511) $58.00Passenger All 1,000 - 19,189 (6,010) $478.40Reefer All 1,000- 19,126 (6,561) $17.30Ro-Ro All 1,000 - 19,126 (7,819) $41.20Tanker Coastal 1,000 - 23,853 (7,118) $20.80 Handymax 25,000 - 39,999 (34,422) $59.00 Panamax 40,000 - 75,992 (52,300) $63.00 AFR Amax 76,000 - 117,153 (103,112) $77.00 Suezmax 121,109 - 167,294 (153,445) $95.00 VLCC 180,377 - 319,994 (294,475) $154.00 Table 5 Summary of Estimated Market Impacts ? Fuel MarketsFuel Units Baseline Price Control Price Adjusted for %Change Energy Density Distillate $/ton $462.00 $468.00 N/A +1.30% Residual $/ton $322.00 $321.00 N/A -0.30% Fuel Switching $/ton $322.00 $468.00 $444.00 +38.90%Table 6 Summary of Impacts of Operational Fuel Cost Increases Vessel Type Vessel & Engine Parameters Operational Price Increase Container 36,540 kW 50,814 DWT $17.53/TEU North PaciÞ c Circle Route Bulk Carrier 3,825 kW 16,600 DWT $0.56/ton North PaciÞ c Circle Route Cruise Liner (Alaska) 31,500 kW 226,000 DWT $6.60/per passenger/day 1,886 passengers Table 7 Total Costs MARPOL Annex VI (Revised) Year Fixed Variable Operational Total 2010 $477,020 $0 $0 $477,020 2011 $1,018,766 $2,497,657 $1,306,556 $4,822,979 2012 $1,056,245 $2,580,365 $6,431,250 $10,067,860 2013 $1,095,347 $2,667,173 $244,951,550 $248,714,070 2014 $1,136,035 $2,757,514 $260,810,043 $264,703,592 2015 $972,037 $13,954,191 $1,369,402,786 $1,384,329,014 2016 $0 $28,052,583 $1,438,235,966 $1,466,288,549 2017 $0 $29,154,639 $1,525,633,990 $1,554,788,629 2018 $0 $30,302,933 $1,622,800,854 $1,653,103,787 2019 $0 $31,499,499 $1,721,756,141 $1,753,255,640 2020 $0 $32,746,463 $1,820,614,217 $1,853,360,680 2021 $0 $34,046,049 $1,925,263,118 $1,959,309,167 2022 $0 $35,400,583 $2,028,002,568 $2,063,403,151 2023 $0 $36,812,494 $2,147,543,473 $2,184,355,967 2024 $0 $38,284,325 $2,266,962,666 $2,305,246,991 2025 $0 $39,818,735 $2,387,551,773 $2,427,370,508 2026 $0 $41,418,504 $2,512,510,228 $2,553,928,732 2027 $0 $43,086,539 $2,638,815,284 $2,681,901,823 2028 $0 $44,825,880 $2,774,457,455 $2,819,283,335 2029 $0 $46,639,709 $2,913,118,509 $2,959,758,218 2030 $0 $48,531,352 $3,063,782,201 $3,112,313,553 2031 $0 $50,504,289 $3,205,898,377 $3,256,402,666 2032 $0 $52,562,159 $3,358,465,311 $3,411,027,470 2033 $0 $54,708,770 $3,519,017,395 $3,573,726,165 2034 $0 $56,948,104 $3,689,819,658 $3,746,767,762 2035 $0 $59,284,330 $3,867,580,840 $3,926,865,170 2036 $0 $61,721,806 $4,056,506,472 $4,118,228,278 2037 $0 $64,265,093 $4,258,730,159 $4,322,995,252 2038 $0 $66,918,964 $4,465,788,635 $4,532,707,599 2039 $0 $69,688,411 $4,680,205,640 $4,749,894,051 2040 $0 $72,578,659 $4,905,310,074 $4,977,888,733 NPV @ 3% $5,311,963 $683,356,096 $42,179,757,713 $42,868,425,772 NPV@ 7% $4,805,557 $358,019,816 $21,724,932,914 $22,087,758,287 MR #6 (34-41).indd 38MR #6 (34-41).indd 385/30/2013 1:05:22 PM5/30/2013 1:05:22 PM
