
Page 12: of Maritime Reporter Magazine (May 2014)
Marine Electronics Edition
Read this page in Pdf, Flash or Html5 edition of May 2014 Maritime Reporter Magazine
 11
11
 13
13
12 Maritime Reporter & Engineering News • MAY 2014
NEWS - OFFSHORE UPDATE
A n EPC contract for a pro- duction unit can easily ex- ceed $1 billion – and $3 billion for an FPSO has re- cently been breached. Overall, this is a $20 to $30 billion annual market. But, as described below, the sector is hitting some headwinds that could impact fu- ture business opportunities.
Backlog of Planned Floater Projects 243 fl oating production projects are in various stages of planning as of be- ginning May. Of these, 57% involve an FPSO, 16% another type oil/gas production fl oater, 23% liquefaction or regasifi cation fl oater and 5% storage/ offl oading fl oater.
Brazil, Africa and SE Asia are the major locations of fl oating production projects in the visible planning stage.
We are tracking 50 projects in Brazil, 49 in Africa and 46 projects in SEA – 60% of the visible planned fl oating pro- duction projects worldwide.
Around 25% of the projects are at an advanced stage of development. They typically have either entered the FEED phase, pre-qualifi cation of fl oater con- tractors has been initiated or bidding/ negotiation is in progress. Award of the production fl oater contract in these projects is likely within the next 2-3 years. The remaining 75% of the planned projects are in an early stage of development. Contract awards are more likely in the 3+ year time frame.
Future Business Drivers
The large number of projects at the ready-to-go stage is clearly a positive indicator for future fl oating production equipment orders. However, timing of the decision to proceed to contracting will be infl uenced by future underlying market conditions. Fundamentals driv- ing future orders in the fl oating produc- tion market remain generally positive.
World oil and gas demand continues to grow, crude pricing remains in the $100 to $110 range and deepwater drillers are operating at high utilization. But the sector is hitting competition from shale/ tight oil and gas supply, energy compa- nies have been cutting capital spending budgets and deepwater drillers are not quite as bullish as in recent past.
Growing Demand for Oil and Gas
On the positive side, global oil de- mand has grown at an average rate of 1.4% annually over the past 20 years.
With the exception of two years dur- ing the global fi nancial meltdown, oil demand has increased year over year during this period. Growth in oil de- mand is widely expected to continue over the foreseeable future. The IEA, for example, sees world oil demand in 2035 growing to 101 mb/d, an increase of 11% over today. Global natural gas demand is also growing. Gas consump- tion doubled between 1980 and 2010 and has grown another 13% since.
Over the past decade global natural gas consumption declined in only one year – 2009 as a result of the fi nancial crisis.
The EIA sees world gas consump- tion growing at an annual rate of 1.7% through 2040. ExxonMobil projects a 65% increase in natural gas demand by between 2010 and 2040.
Unconventional Oil & Gas Supply
But unconventional oil and gas re- sources are changing the supply land- scape. Use of horizontal drilling and hydraulic fracturing to exploit oil and gas resources locked in shale, siltstone and mudstone, as well as production of oil from oil sands, has opened huge new sources of energy supply.
Nowhere is the development of un- conventional oil resources more rap- idly advancing than in North America.
Between 2011/2014 the production of oil in the US and Canada increased 39%, primarily the result of incremen- tal production of shale/tight oil in the
US and oil sands resources in Canada.
As a result, production of oil in the US and Canada now accounts for 27.6% of non-OPEC oil production – up from 22% in 2011.
Development of shale/tight oil re- sources outside the US has been much slower due to land rights issues, access to drill equipment, environmental op- position to fracking, etc. But the shale/ tight oil revolution will undoubtedly spread beyond the US. Opportunities are too big to ignore. The EIA estimates that shale/tight oil resources worldwide total 345 billion barrels – and account for 10 percent of global oil reserves.
The equally spectacular revolution in shale/tight gas production is changing global gas supply and is threatening the dominance of major players in the LNG sector. And like shale/tight oil, the shale/tight gas revolution is centered in
North America.
Production of shale/tight gas in the
US is projected to grow 52% over the next decade. According to the EIA, shale and tight gas is expected to pro- vide 71% of US natural gas production in 2024, up from 61% today. In 2024 the US is expected to be producing 22.5
TCF of natural gas from shale and tight rock formations – the equivalent of more than three times the current natu- ral gas production of Qatar.
A substantial, though yet unclear, por- tion of future U.S. gas production will be exported as LNG. BP expects that the U.S. “will become a net LNG ex- porter from 2016, reaching a total net
LNG export volume of 11.2 Bcf/d by 2035.” ExxonMobil sees North Ameri- ca shifting “from a net importer to a net exporter of natural gas by 2020 as pro- duction outpaces demand.”
Like oil, development of shale/tight
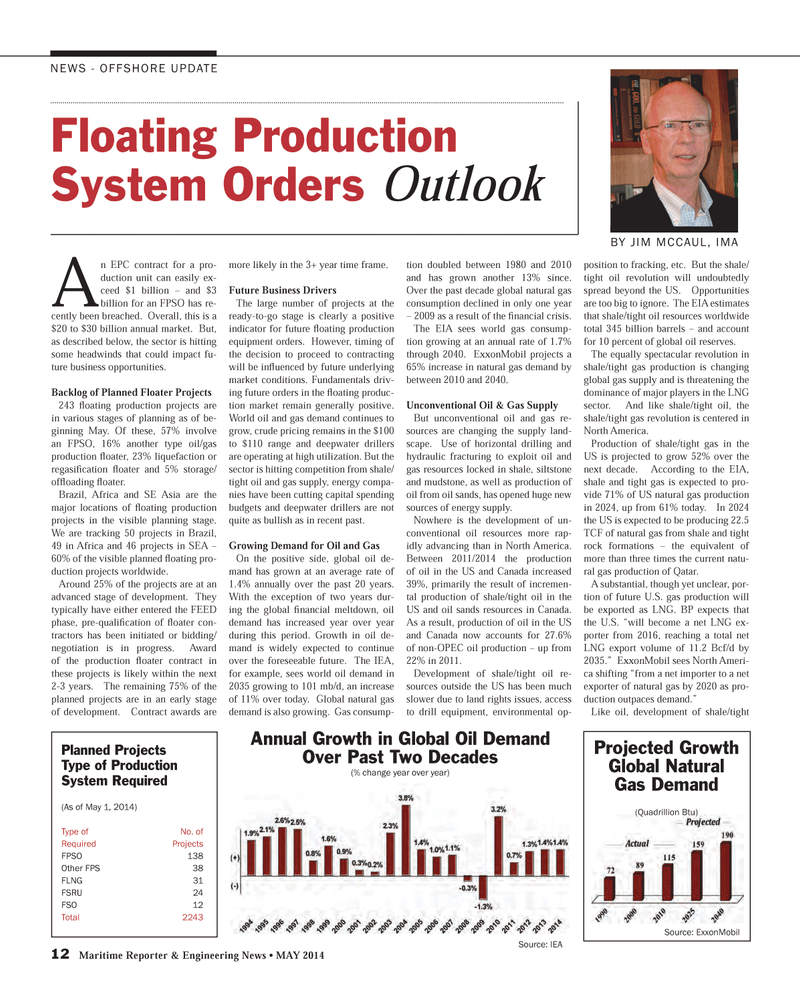
Floating Production
System Orders Outlook
BY JIM MCCAUL, IMA
Planned Projects
Type of Production
System Required (As of May 1, 2014)
Type of No. of
Required Projects
FPSO 138
Other FPS 38
FLNG 31
FSRU 24
FSO 12
Total 2243
Annual Growth in Global Oil Demand
Over Past Two Decades (% change year over year)
Source: IEA
Projected Growth
Global Natural
Gas Demand (Quadrillion Btu)
Source: ExxonMobil
MR #5 (10-17).indd 12 5/1/2014 10:18:10 AM
