Page 48: of Maritime Reporter Magazine (September 2016)
Maritime & Ship Security
Read this page in Pdf, Flash or Html5 edition of September 2016 Maritime Reporter Magazine
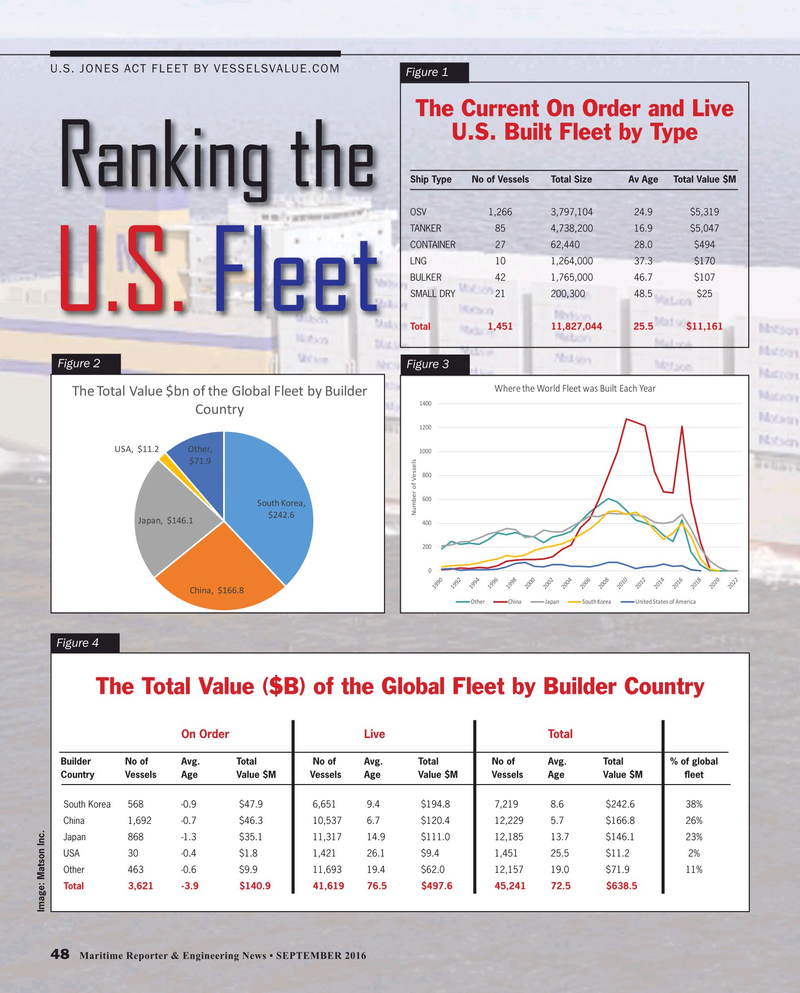
U.S. JONES ACT FLEET BY VESSELSVALUE.COM
Figure 1
The Current On Order and Live
U.S. Built Fleet by Type
Ship Type No of Vessels Total Size Av Age Total Value $M
Ranking the
OSV 1,266 3,797,104 24.9 $5,319
TANKER 85 4,738,200 16.9 $5,047
CONTAINER 27 62,440 28.0 $494
LNG 10 1,264,000 37.3 $170
BULKER 42 1,765,000 46.7 $107
SMALL DRY 21 200,300 48.5 $25
U.S. Fleet
Total 1,451 11,827,044 25.5 $11,161
Figure 2 Figure 3
Where the World Fleet was Built Each Year
The Total Value $bn of the Global Fleet by Builder 1400
Country 1200
USA, $11.2 Other, 1000 $71.9 800 600
South Korea,
Number of Vessels $242.6
Japan, $146.1 400 200 0
China, $166.8
Other China Japan South Korea United States of America
Figure 4
The Total Value ($B) of the Global Fleet by Builder Country On Order Live Total
Builder No of Avg. Total No of Avg. Total No of Avg. Total % of global
Country Vessels Age Value $M Vessels Age Value $M Vessels Age Value $M ? eet South Korea 568 -0.9 $47.9 6,651 9.4 $194.8 7,219 8.6 $242.6 38% China 1,692 -0.7 $46.3 10,537 6.7 $120.4 12,229 5.7 $166.8 26% Japan 868 -1.3 $35.1 11,317 14.9 $111.0 12,185 13.7 $146.1 23% USA 30 -0.4 $1.8 1,421 26.1 $9.4 1,451 25.5 $11.2 2% Other 463 -0.6 $9.9 11,693 19.4 $62.0 12,157 19.0 $71.9 11% Total 3,621 -3.9 $140.9 41,619 76.5 $497.6 45,241 72.5 $638.5
Image: Matson Inc.
48 Maritime Reporter & Engineering News • SEPTEMBER 2016
MR #9 (42-49).indd 48 9/2/2016 11:44:55 AM

 47
47

 49
49
