
Page 72: of Maritime Reporter Magazine (March 2018)
Annual World Yearbook
Read this page in Pdf, Flash or Html5 edition of March 2018 Maritime Reporter Magazine
 71
71
 73
73
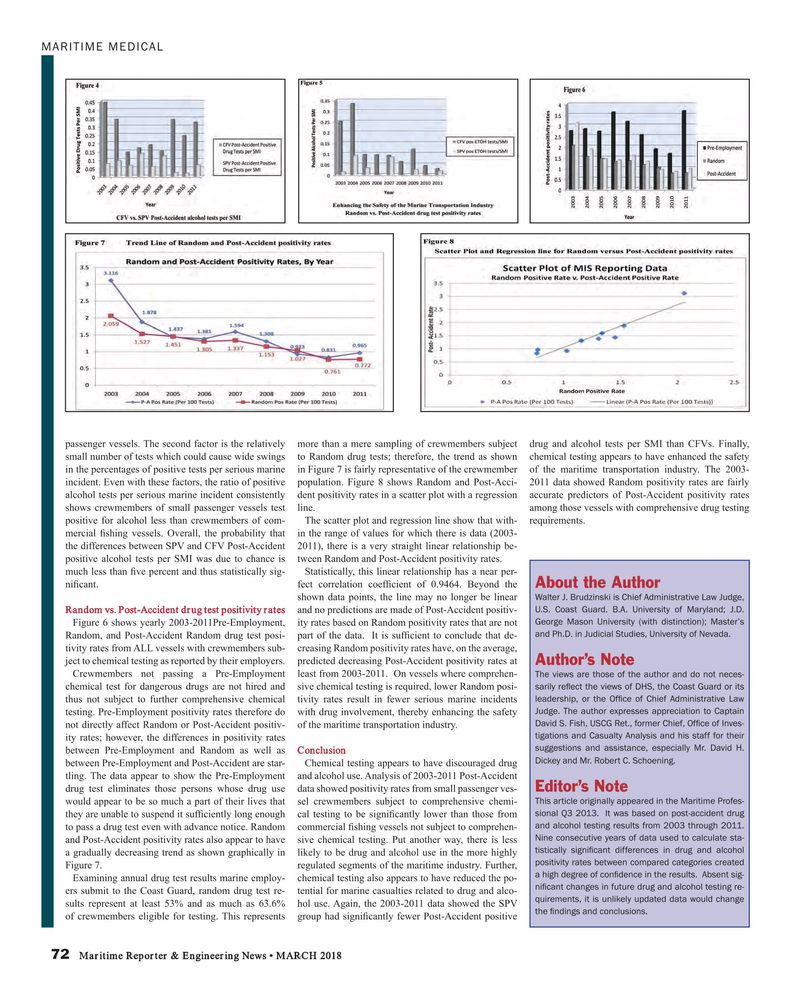
MARITIME MEDICAL passenger vessels. The second factor is the relatively more than a mere sampling of crewmembers subject drug and alcohol tests per SMI than CFVs. Finally, small number of tests which could cause wide swings to Random drug tests; therefore, the trend as shown chemical testing appears to have enhanced the safety in the percentages of positive tests per serious marine in Figure 7 is fairly representative of the crewmember of the maritime transportation industry. The 2003- incident. Even with these factors, the ratio of positive population. Figure 8 shows Random and Post-Acci- 2011 data showed Random positivity rates are fairly alcohol tests per serious marine incident consistently dent positivity rates in a scatter plot with a regression accurate predictors of Post-Accident positivity rates shows crewmembers of small passenger vessels test line. among those vessels with comprehensive drug testing positive for alcohol less than crewmembers of com- The scatter plot and regression line show that with- requirements. mercial ? shing vessels. Overall, the probability that in the range of values for which there is data (2003- the differences between SPV and CFV Post-Accident 2011), there is a very straight linear relationship be- positive alcohol tests per SMI was due to chance is tween Random and Post-Accident positivity rates.
much less than ? ve percent and thus statistically sig- Statistically, this linear relationship has a near per- ni? cant. fect correlation coef? cient of 0.9464. Beyond the
About the Author
Walter J. Brudzinski is Chief Administrative Law Judge, shown data points, the line may no longer be linear
U.S. Coast Guard. B.A. University of Maryland; J.D.
Random vs. Post-Accident drug test positivity rates and no predictions are made of Post-Accident positiv-
George Mason University (with distinction); Master’s
Figure 6 shows yearly 2003-2011Pre-Employment, ity rates based on Random positivity rates that are not and Ph.D. in Judicial Studies, University of Nevada.
Random, and Post-Accident Random drug test posi- part of the data. It is suf? cient to conclude that de- tivity rates from ALL vessels with crewmembers sub- creasing Random positivity rates have, on the average, ject to chemical testing as reported by their employers. predicted decreasing Post-Accident positivity rates at
Author’s Note
Crewmembers not passing a Pre-Employment least from 2003-2011. On vessels where comprehen-
The views are those of the author and do not neces- sarily re? ect the views of DHS, the Coast Guard or its chemical test for dangerous drugs are not hired and sive chemical testing is required, lower Random posi- leadership, or the Of? ce of Chief Administrative Law thus not subject to further comprehensive chemical tivity rates result in fewer serious marine incidents
Judge. The author expresses appreciation to Captain testing. Pre-Employment positivity rates therefore do with drug involvement, thereby enhancing the safety
David S. Fish, USCG Ret., former Chief, Of? ce of Inves- not directly affect Random or Post-Accident positiv- of the maritime transportation industry. tigations and Casualty Analysis and his staff for their ity rates; however, the differences in positivity rates suggestions and assistance, especially Mr. David H. between Pre-Employment and Random as well as Conclusion
Dickey and Mr. Robert C. Schoening.
between Pre-Employment and Post-Accident are star- Chemical testing appears to have discouraged drug tling. The data appear to show the Pre-Employment and alcohol use. Analysis of 2003-2011 Post-Accident
Editor’s Note drug test eliminates those persons whose drug use data showed positivity rates from small passenger ves-
This article originally appeared in the Maritime Profes- would appear to be so much a part of their lives that sel crewmembers subject to comprehensive chemi- sional Q3 2013. It was based on post-accident drug they are unable to suspend it suf? ciently long enough cal testing to be signi? cantly lower than those from and alcohol testing results from 2003 through 2011. to pass a drug test even with advance notice. Random commercial ? shing vessels not subject to comprehen-
Nine consecutive years of data used to calculate sta- and Post-Accident positivity rates also appear to have sive chemical testing. Put another way, there is less tistically signi? cant differences in drug and alcohol a gradually decreasing trend as shown graphically in likely to be drug and alcohol use in the more highly positivity rates between compared categories created
Figure 7. regulated segments of the maritime industry. Further, a high degree of con? dence in the results. Absent sig-
Examining annual drug test results marine employ- chemical testing also appears to have reduced the po- ni? cant changes in future drug and alcohol testing re- ers submit to the Coast Guard, random drug test re- tential for marine casualties related to drug and alco- quirements, it is unlikely updated data would change sults represent at least 53% and as much as 63.6% hol use. Again, the 2003-2011 data showed the SPV the ? ndings and conclusions. of crewmembers eligible for testing. This represents group had signi? cantly fewer Post-Accident positive 72 Maritime Reporter & Engineering News • MARCH 2018
MR #3 (66-73).indd 72 MR #3 (66-73).indd 72 3/7/2018 9:11:44 AM3/7/2018 9:11:44 AM
