
Page 49: of Maritime Reporter Magazine (April 2018)
Offshore Energy Annual
Read this page in Pdf, Flash or Html5 edition of April 2018 Maritime Reporter Magazine
 48
48
 50
50
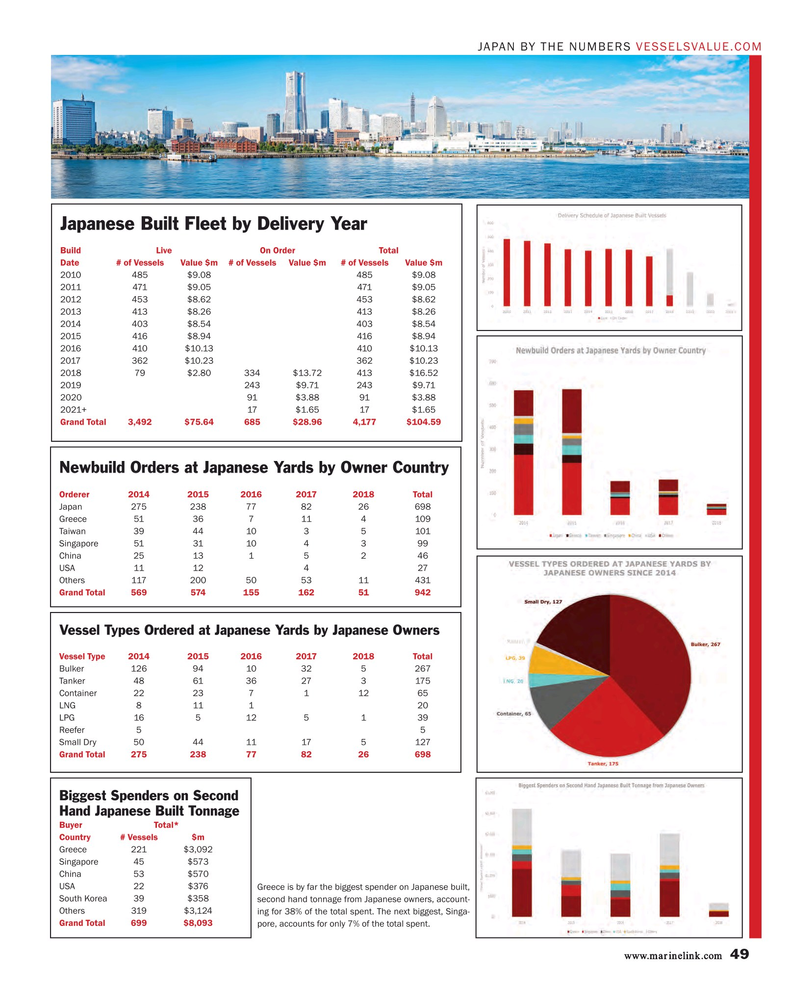
JAPAN BY THE NUMBERS VESSELSVALUE.COM
Japanese Built Fleet by Delivery Year
Build Live On Order Total
Date # of Vessels Value $m # of Vessels Value $m # of Vessels Value $m 2010 485 $9.08 485 $9.08 2011 471 $9.05 471 $9.05 2012 453 $8.62 453 $8.62 2013 413 $8.26 413 $8.26 2014 403 $8.54 403 $8.54 2015 416 $8.94 416 $8.94 2016 410 $10.13 410 $10.13 2017 362 $10.23 362 $10.23 2018 79 $2.80 334 $13.72 413 $16.52 2019 243 $9.71 243 $9.71 2020 91 $3.88 91 $3.88 2021+ 17 $1.65 17 $1.65
Grand Total 3,492 $75.64 685 $28.96 4,177 $104.59
Newbuild Orders at Japanese Yards by Owner Country
Orderer 2014 2015 2016 2017 2018 Total
Japan 275 238 77 82 26 698
Greece 51 36 7 11 4 109
Taiwan 39 44 10 3 5 101
Singapore 51 31 10 4 3 99
China 25 13 1 5 2 46
USA 11 12 4 27
Others 117 200 50 53 11 431
Grand Total 569 574 155 162 51 942
Vessel Types Ordered at Japanese Yards by Japanese Owners
Vessel Type 2014 2015 2016 2017 2018 Total
Bulker 126 94 10 32 5 267
Tanker 48 61 36 27 3 175
Container 22 23 7 1 12 65
LNG 8 11 1 20
LPG 16 5 12 5 1 39
Reefer 5 5
Small Dry 50 44 11 17 5 127
Grand Total 275 238 77 82 26 698
Biggest Spenders on Second
Hand Japanese Built Tonnage
Buyer Total*
Country # Vessels $m
Greece 221 $3,092
Singapore 45 $573
China 53 $570
USA 22 $376 Greece is by far the biggest spender on Japanese built,
South Korea 39 $358 second hand tonnage from Japanese owners, account-
Others 319 $3,124 ing for 38% of the total spent. The next biggest, Singa-
Grand Total 699 $8,093 pore, accounts for only 7% of the total spent. www.marinelink.com 49
MR #4 (42-49).indd 49 MR #4 (42-49).indd 49 4/6/2018 10:09:36 AM4/6/2018 10:09:36 AM
